Supporting Nebraska's Children with Disabilities
A disability is defined as a medical or other health-related condition of the body or mind that makes it more difficult for the person with the condition to do certain activities and interact with the world around them.1 With 3.7% of Nebraska kids having a disability, 14.7% being classified as special education, and 16.7% having a special health need, we, as a state, must ensure our systems are set up in an inclusive manner so that all children have equitable access to opportunity.
Children with disabilities and their families experience barriers to their basic human rights and inclusion in our society. Their abilities are frequently overlooked and underestimated, while simultaneously their needs are given low priority. The barriers these children and their families face are more frequently the result of their environment and public policies rather than their impairment. These barriers include physical obstacles and societal attitudes2, and they must be prevented, reduced, or eliminated. Meaningful inclusion supports children with disabilities in reaching their full potential, resulting in broad societal benefits.3
Definition of Disability:3
Disability is an umbrella term reflecting the interaction between a person’s body and the society in which they live. People with disabilities experience one or more of the following three dimensions:
- Impairment in body structure or function, or mental functioning, e.g. loss of a limb, loss of vision, or memory loss.
- Activity limitation due to difficulty seeing, hearing, walking, speaking, using the hands, or solving problems.
- Participation restrictions in normal daily activities — doing school work, engaging in social and recreational activities, and obtaining health care and preventive services.4
With the enactment of the Americans with Disabilities Act in 1990, Congress provided a clear and comprehensive mandate for the elimination of discrimination against individuals with a disability, a record of a disability, or who are perceived as having a disability.5
Demographics
Children with disabilities are a diverse group of people with many different types of needs. Additionally, two people with the same type of disability can be affected in different ways, and some disabilities may even be hidden or not easy to see.6
An estimated 17,254 Nebraska children had a disability in 2015, making up 3.7% of all Nebraska kids.7
Disabled Children by Sex (2015)8
- Male (61.4%)
- Female (38.6%)
- Male (61.4%)
- Female (38.6%)
Disabled Children by Age (2015)8
- 5-17 years (94.9%)
- <5 years (5.1%)
- 5-17 years (94.9%)
- <5 years (5.1%)
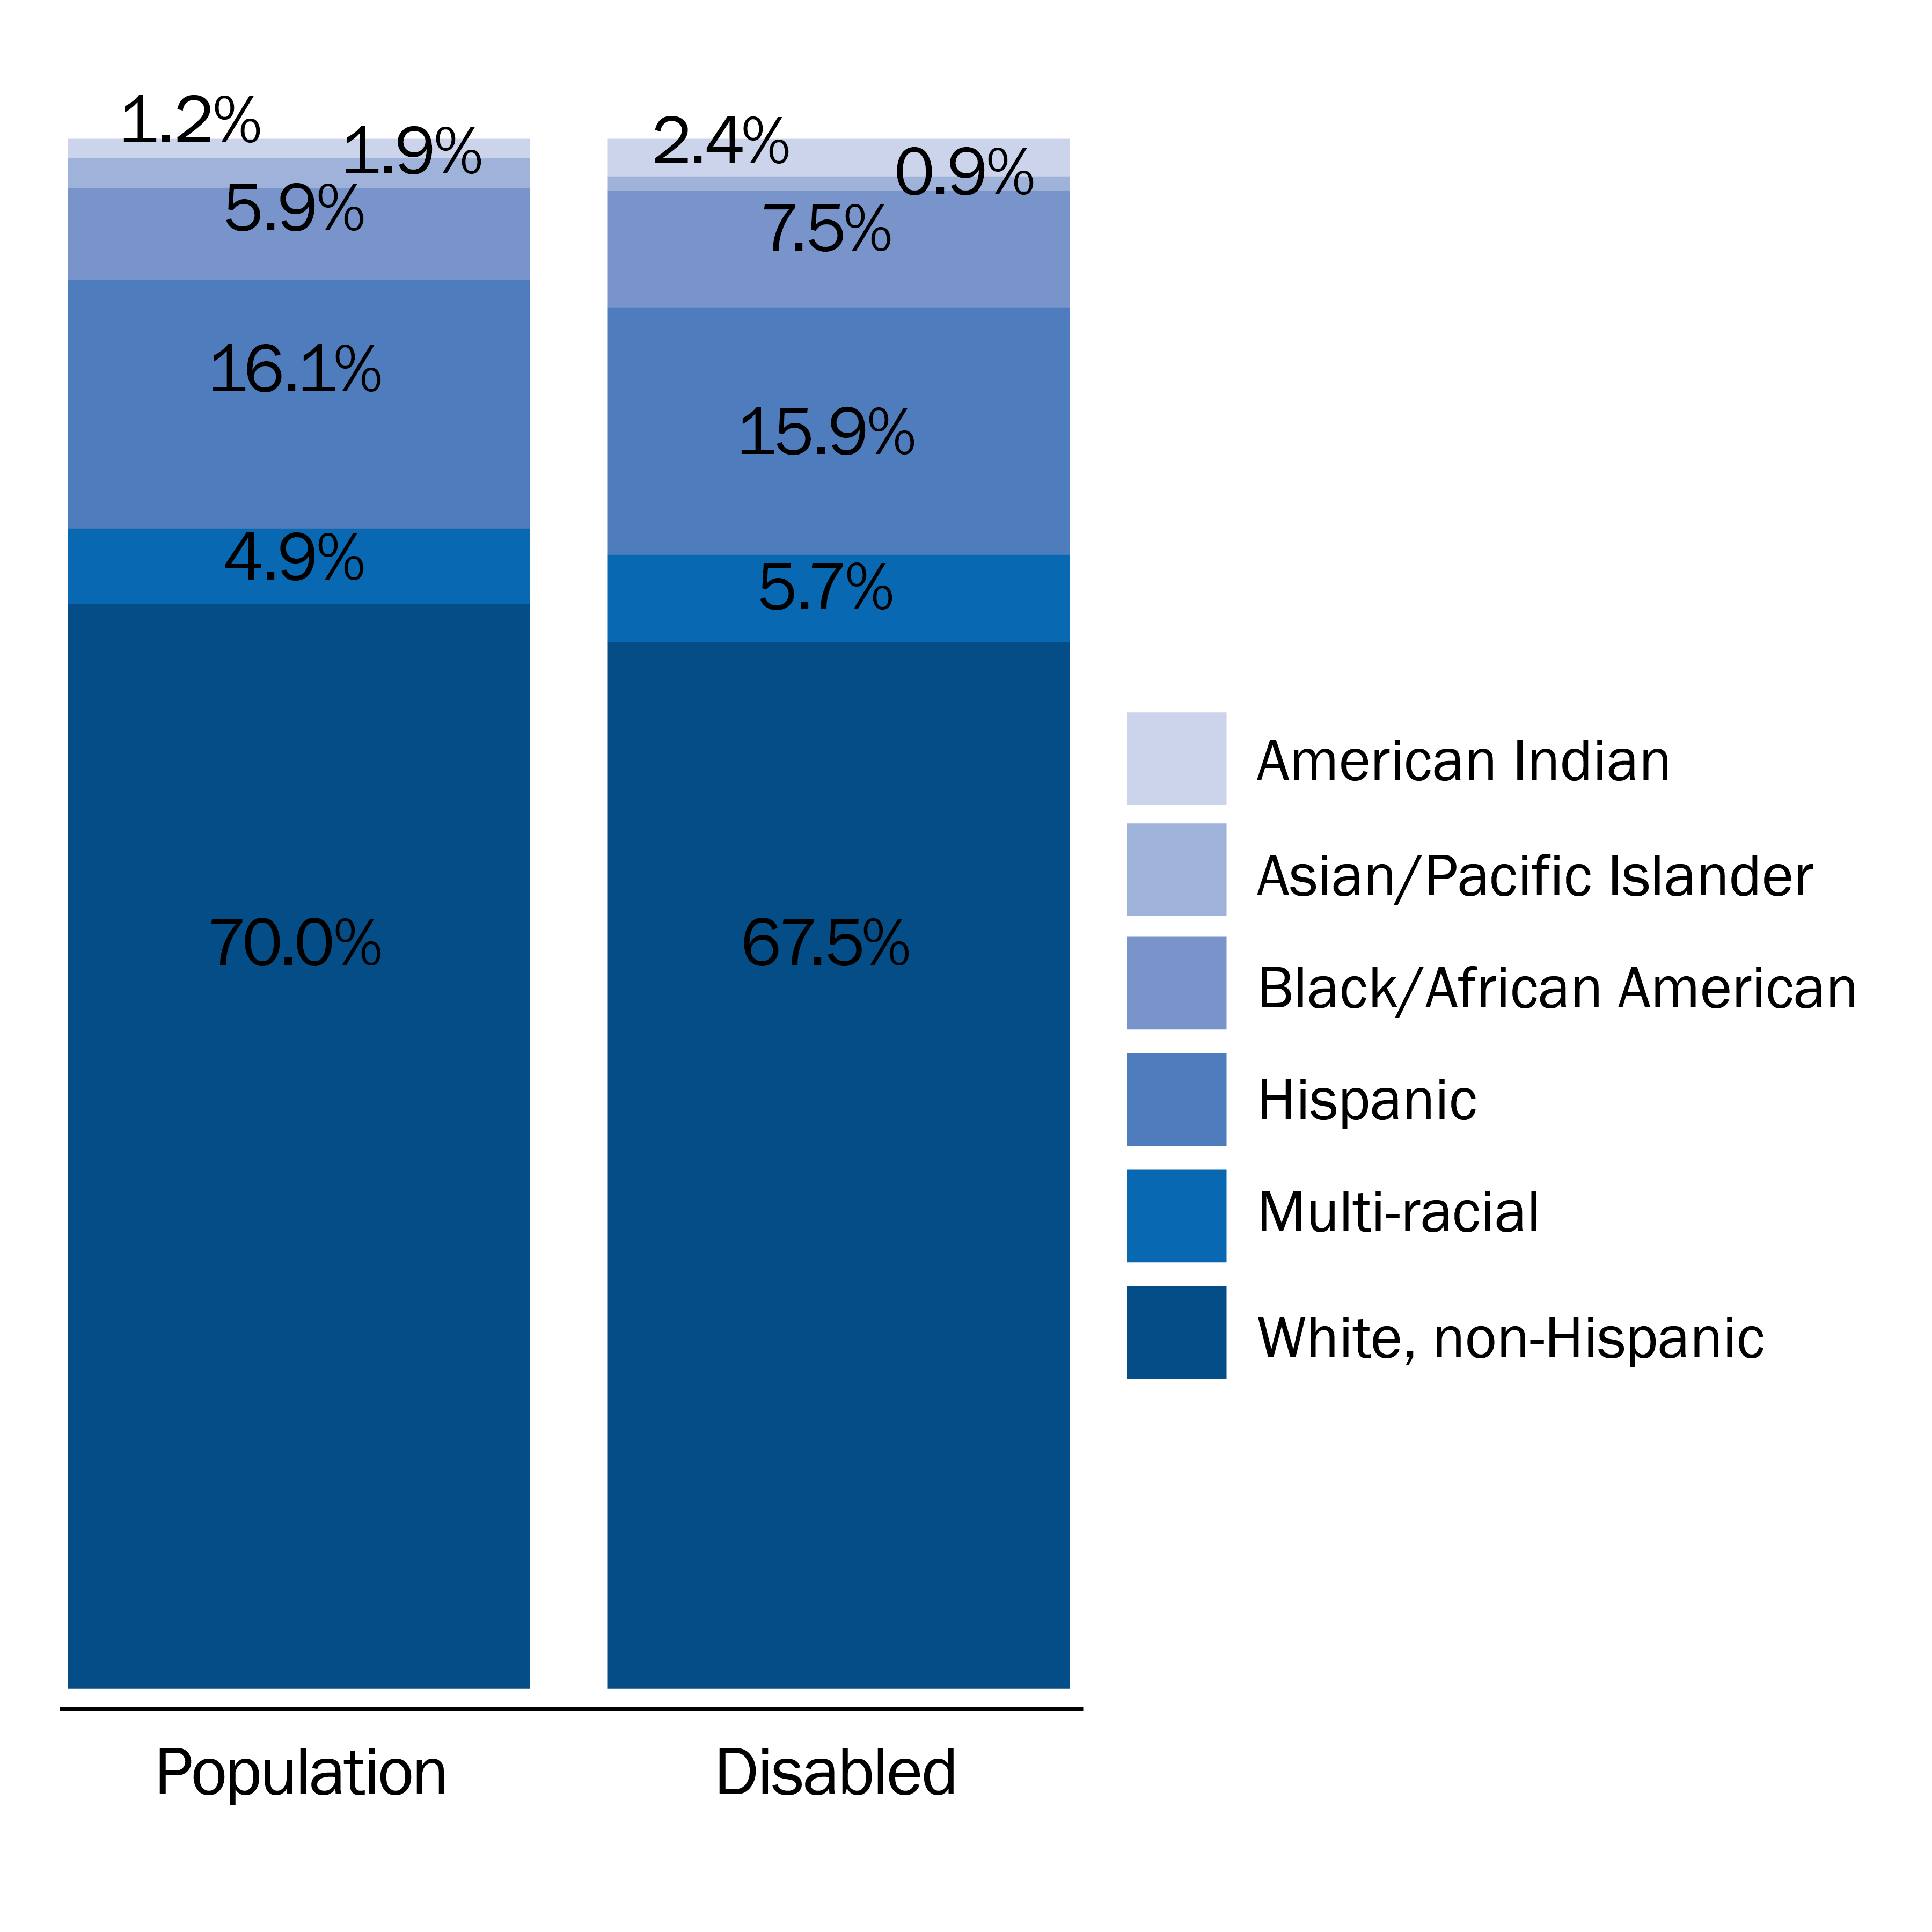
Children by Race/Ethnicity (2015)<sup>9</sup>
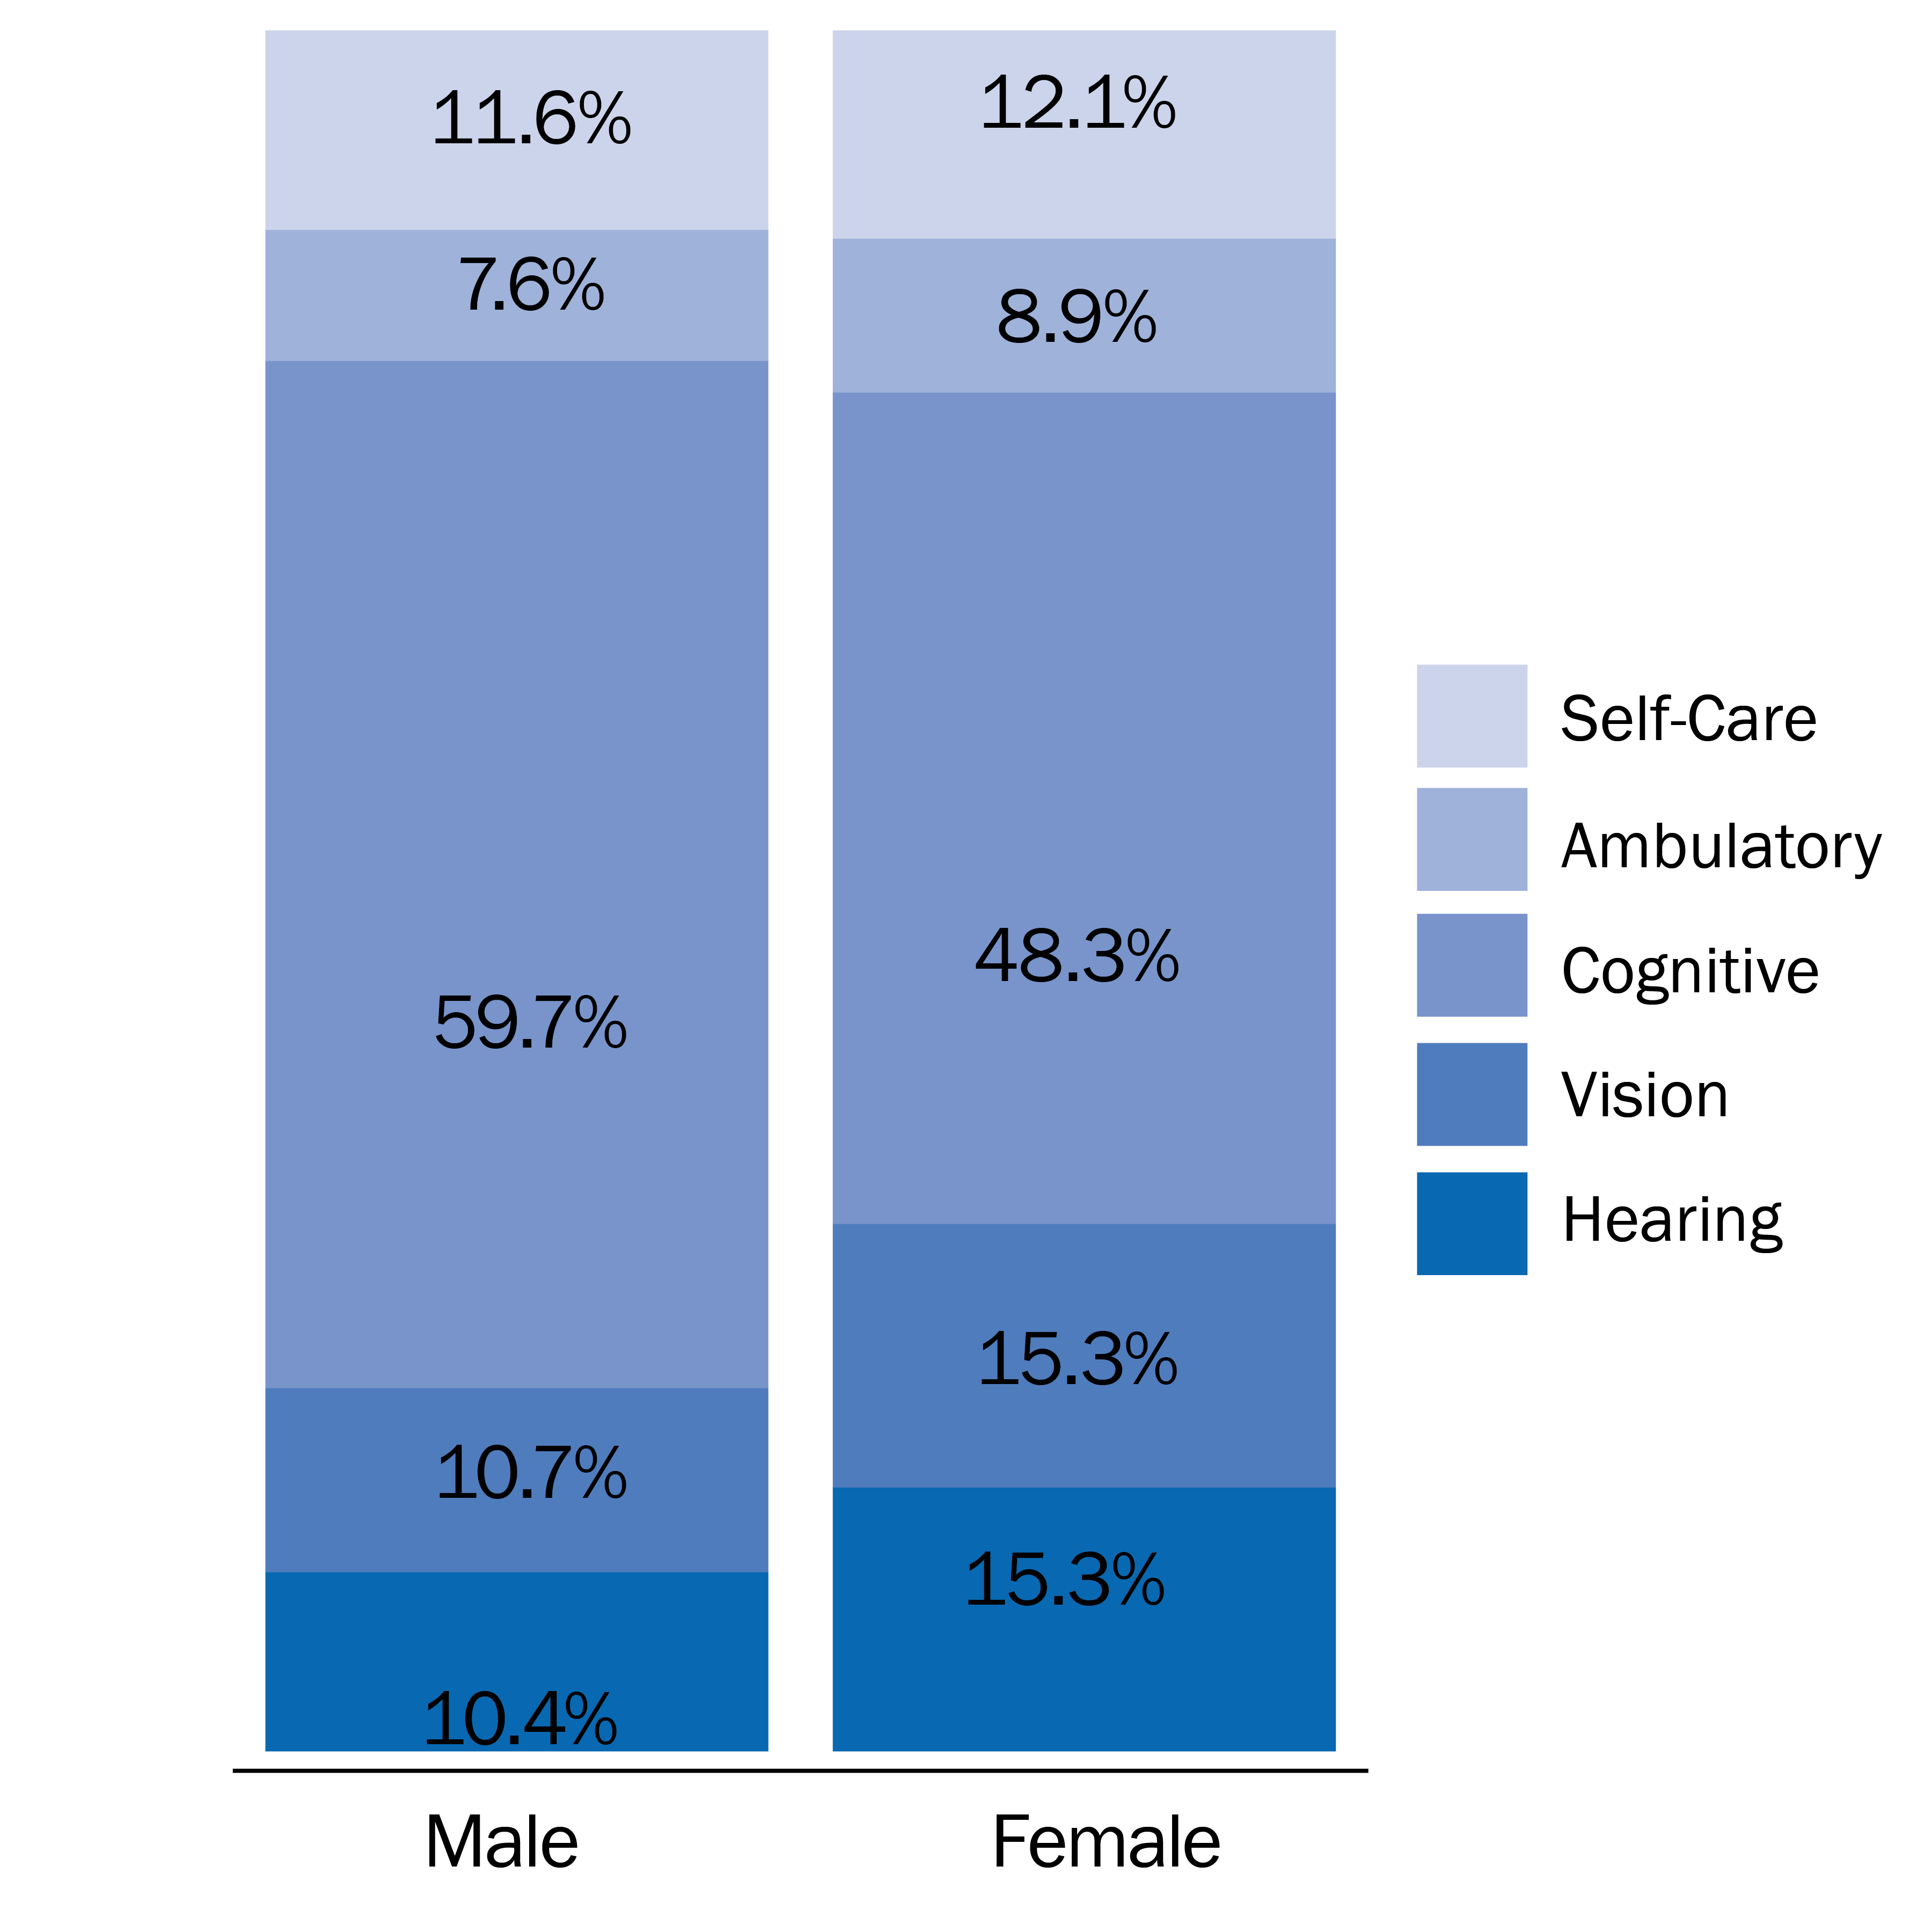
Type of Disability by Sex (2015)<sup>10</sup>
Disabled Children by Age (2015)11
- 2+ Types (23.0%)
- 1 Type (77.0%)
- 2+ Types (23.0%)
- 1 Type (77.0%)
The potential root causes of disabilities in children include a large number of factors beyond just medical and maturational or developmental causes. These can include a family’s financial or economic status, perception of their social status, quality of housing, characteristics of the neighborhood where they live, opportunities for exercise or other recreation, and parental employment and education.
In line with the Kids Count in Nebraska Report’s data sections, we will examine the data outlining the experiences of children with disabilities in the areas of:
- Health,
- Education,
- Economic stability,
- Child welfare system and family supports, and
- Juvenile justice
We also make recommendations for systemic changes to ensure our state systems are supporting these children and families with unique needs and challenges.
Health
According to a 2013 study using data from the National Health Interview Survey, more children today have a disability than a decade ago.12 Between the years of 2001 and 2010, the overall prevalence of disabilities in children increased 16.3% with nearly six million children nationwide having a medical disability diagnosis. This is an increase of over one million children between 2001 and 2010.13 The study classified conditions into three groups — physical, neurodevelopmental or mental health, and other. It was found that while disabilities related to physical health conditions had decreased, those impacting neurodevelopment and mental health experienced increased rates. This was most notable for our youngest children, with rates for children under age six nearly doubling in just two years.14 The reasons for the increase could not be pinpointed and much more research is needed to identify possible causes and solutions.
Children by Special Health Care Need Complexity (2016)15,16
- Children Without Special Needs (83.3%)
- Children with More Complex Needs (11.0%
- Children with Less Complex Needs (5.6%)
- Children Without Special Needs (83.3%)
- Children with More Complex Needs (11.0%
- Children with Less Complex Needs (5.6%)
Of all Nebraska children, 6.7% received services for their special health care need — but only 16% who needed services began receiving them before the age of three.17
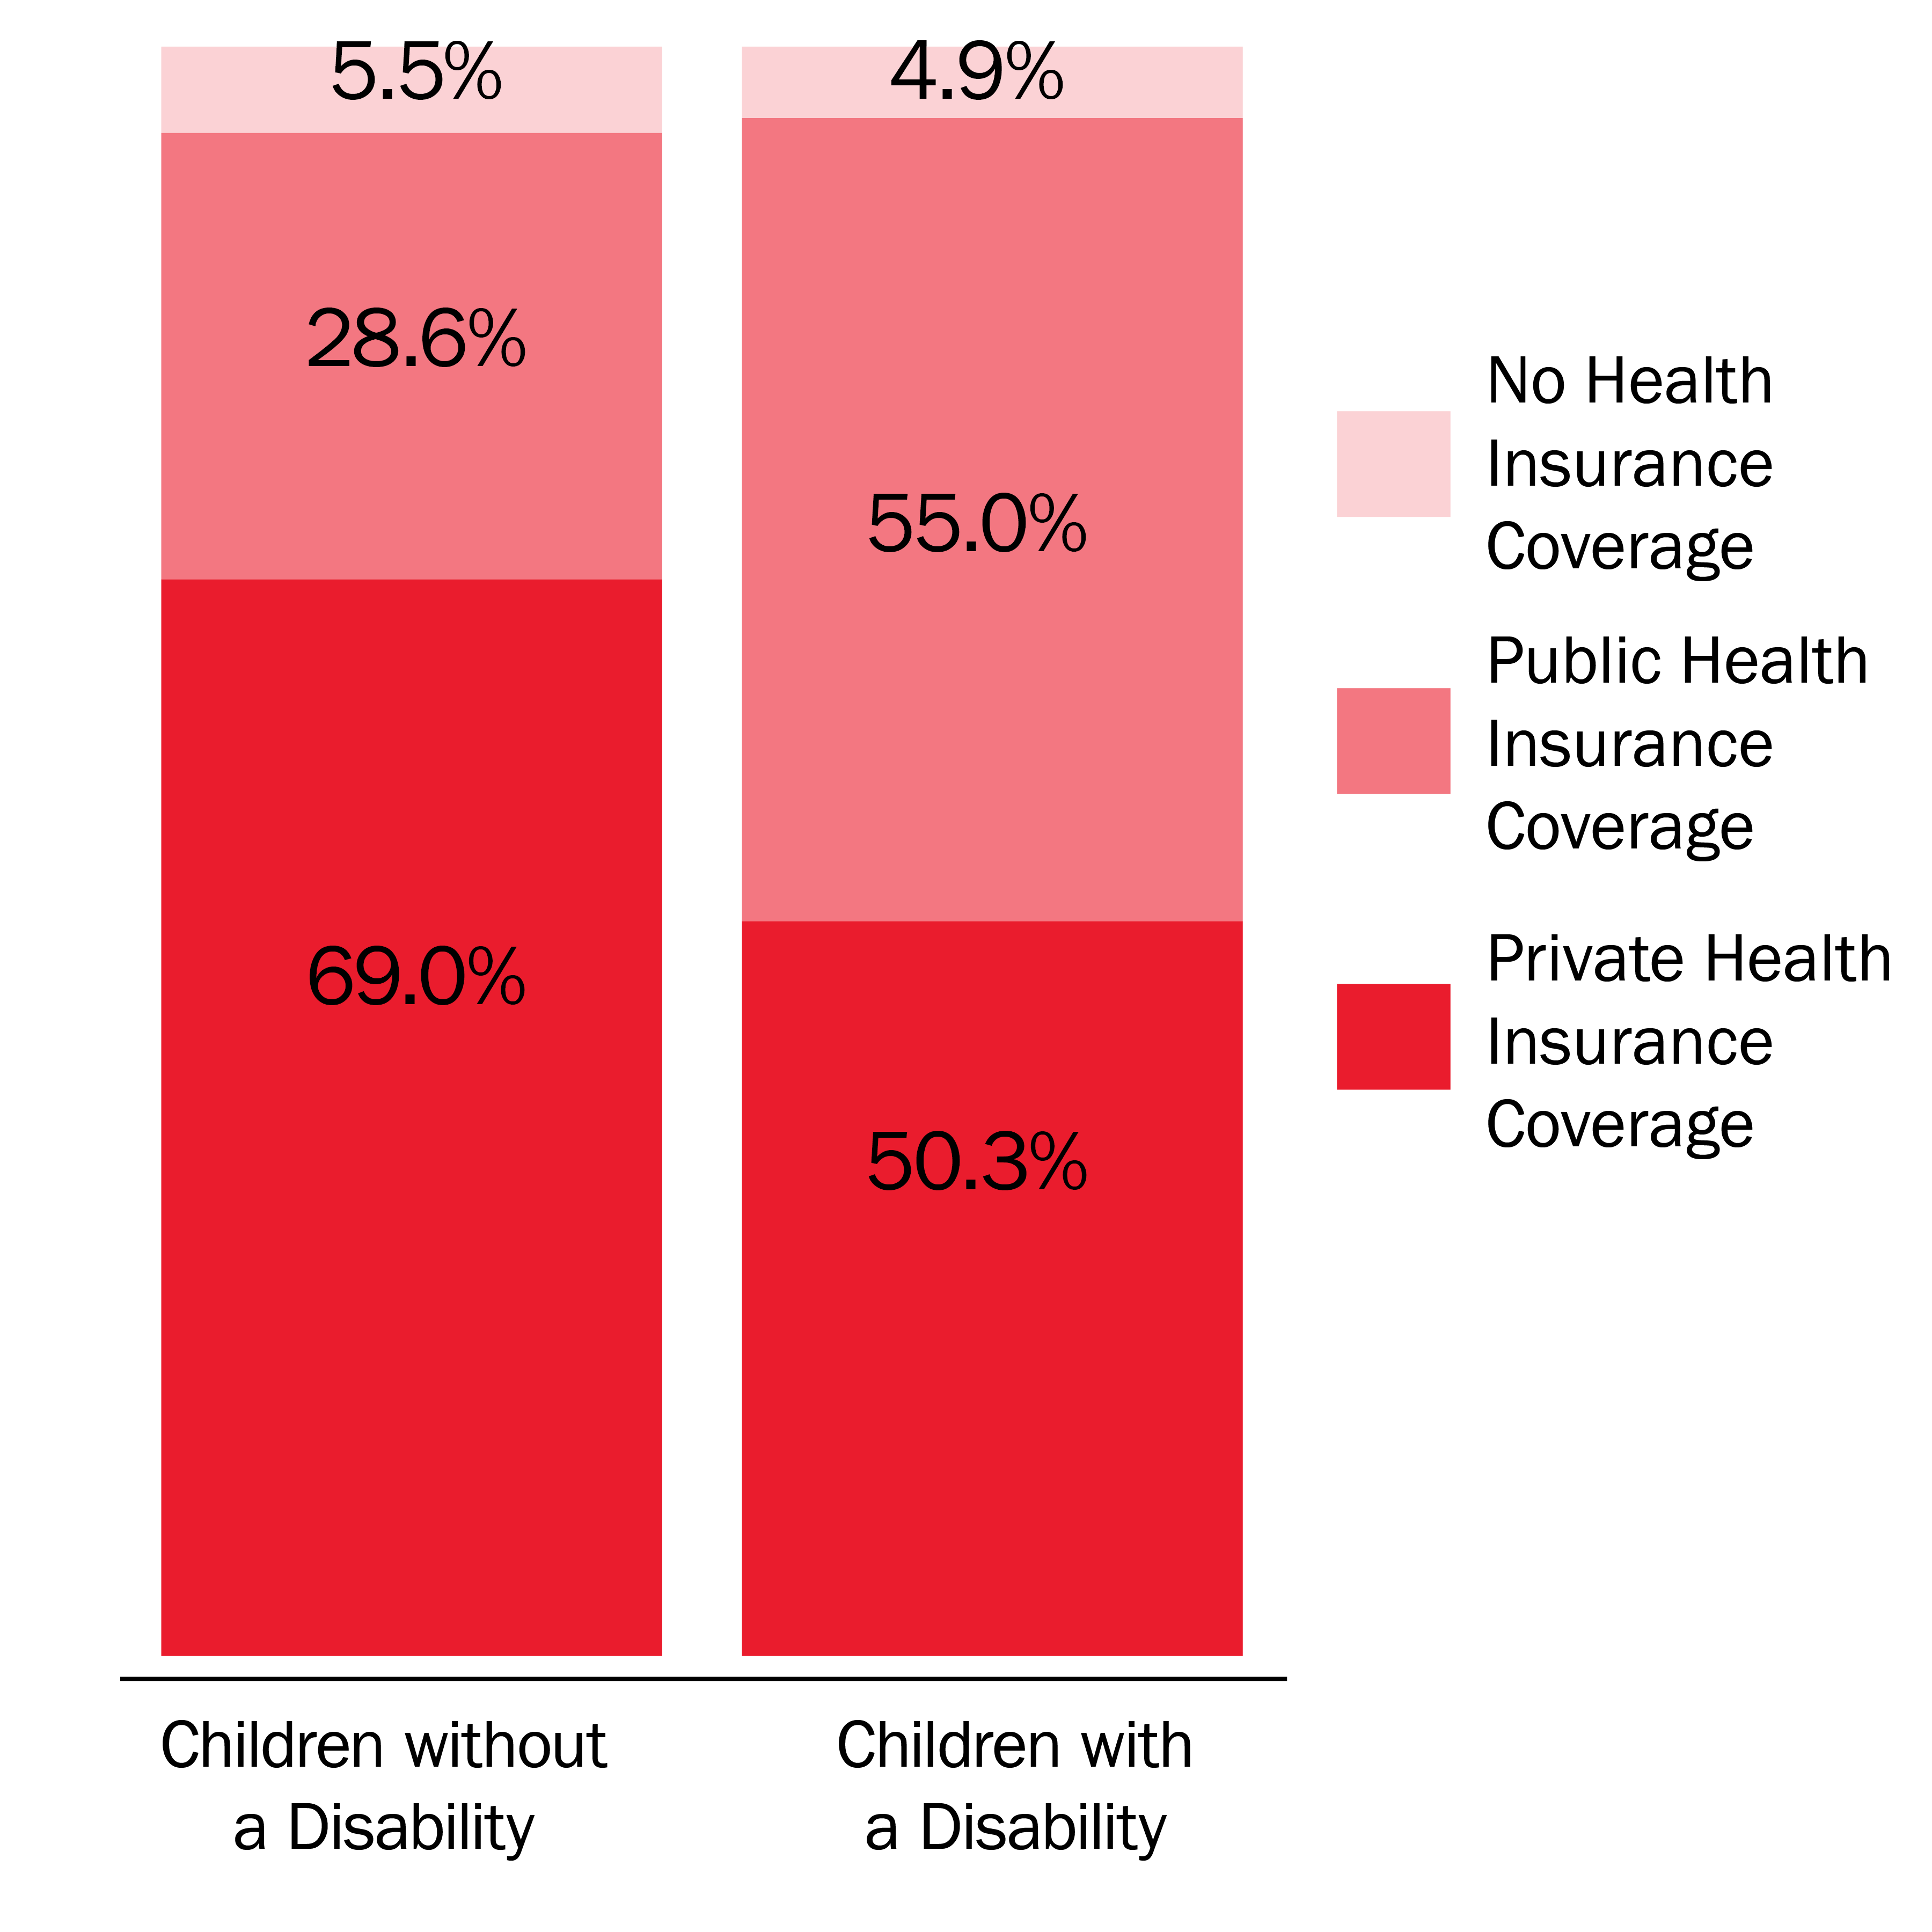
Evidence suggests that health insurance coverage improves access to healthcare for children with disabilities, including having a primary care provider, reducing unmet medical and oral health needs, receiving care in a timely manner, being able to reach a specialist, and having access to ancillary services.19
Children with disabilities present higher medical needs to maintain health and wellness. When compared to the general child population, children with disabilities are more likely to be covered under public health insurance programs. Medicaid and CHIP must be preserved to ensure the basic needs of children with disabilities are met, and our public insurance systems must be strengthened to provide the timely, necessary care these children need to thrive.
Age Children With Special Health Care Needs Began Receiving Services (2016)18
- <3 (15.9%)
- 3-5 (37.3%)
- 6-17 (46.8%)
- <3 (15.9%)
- 3-5 (37.3%)
- 6-17 (46.8%)
Children's Health Insurance Coverage Type (2015) <sup>20</sup>
Receipt of Care from a Health Care Professional by Special Health Care Need Status (2016)21
- Has Received Medical Care from a Health Care Professional in the Last 12 Months
- Has Received a Preventive Medical Visity in the Past Year
- Has Received Health CAre from a Specialist in the Last Year
- Has Received Care from a Mental Health Professional in the Last Year
- Currently Receives Special Services to Meet Developmental Needs
Economic Stability
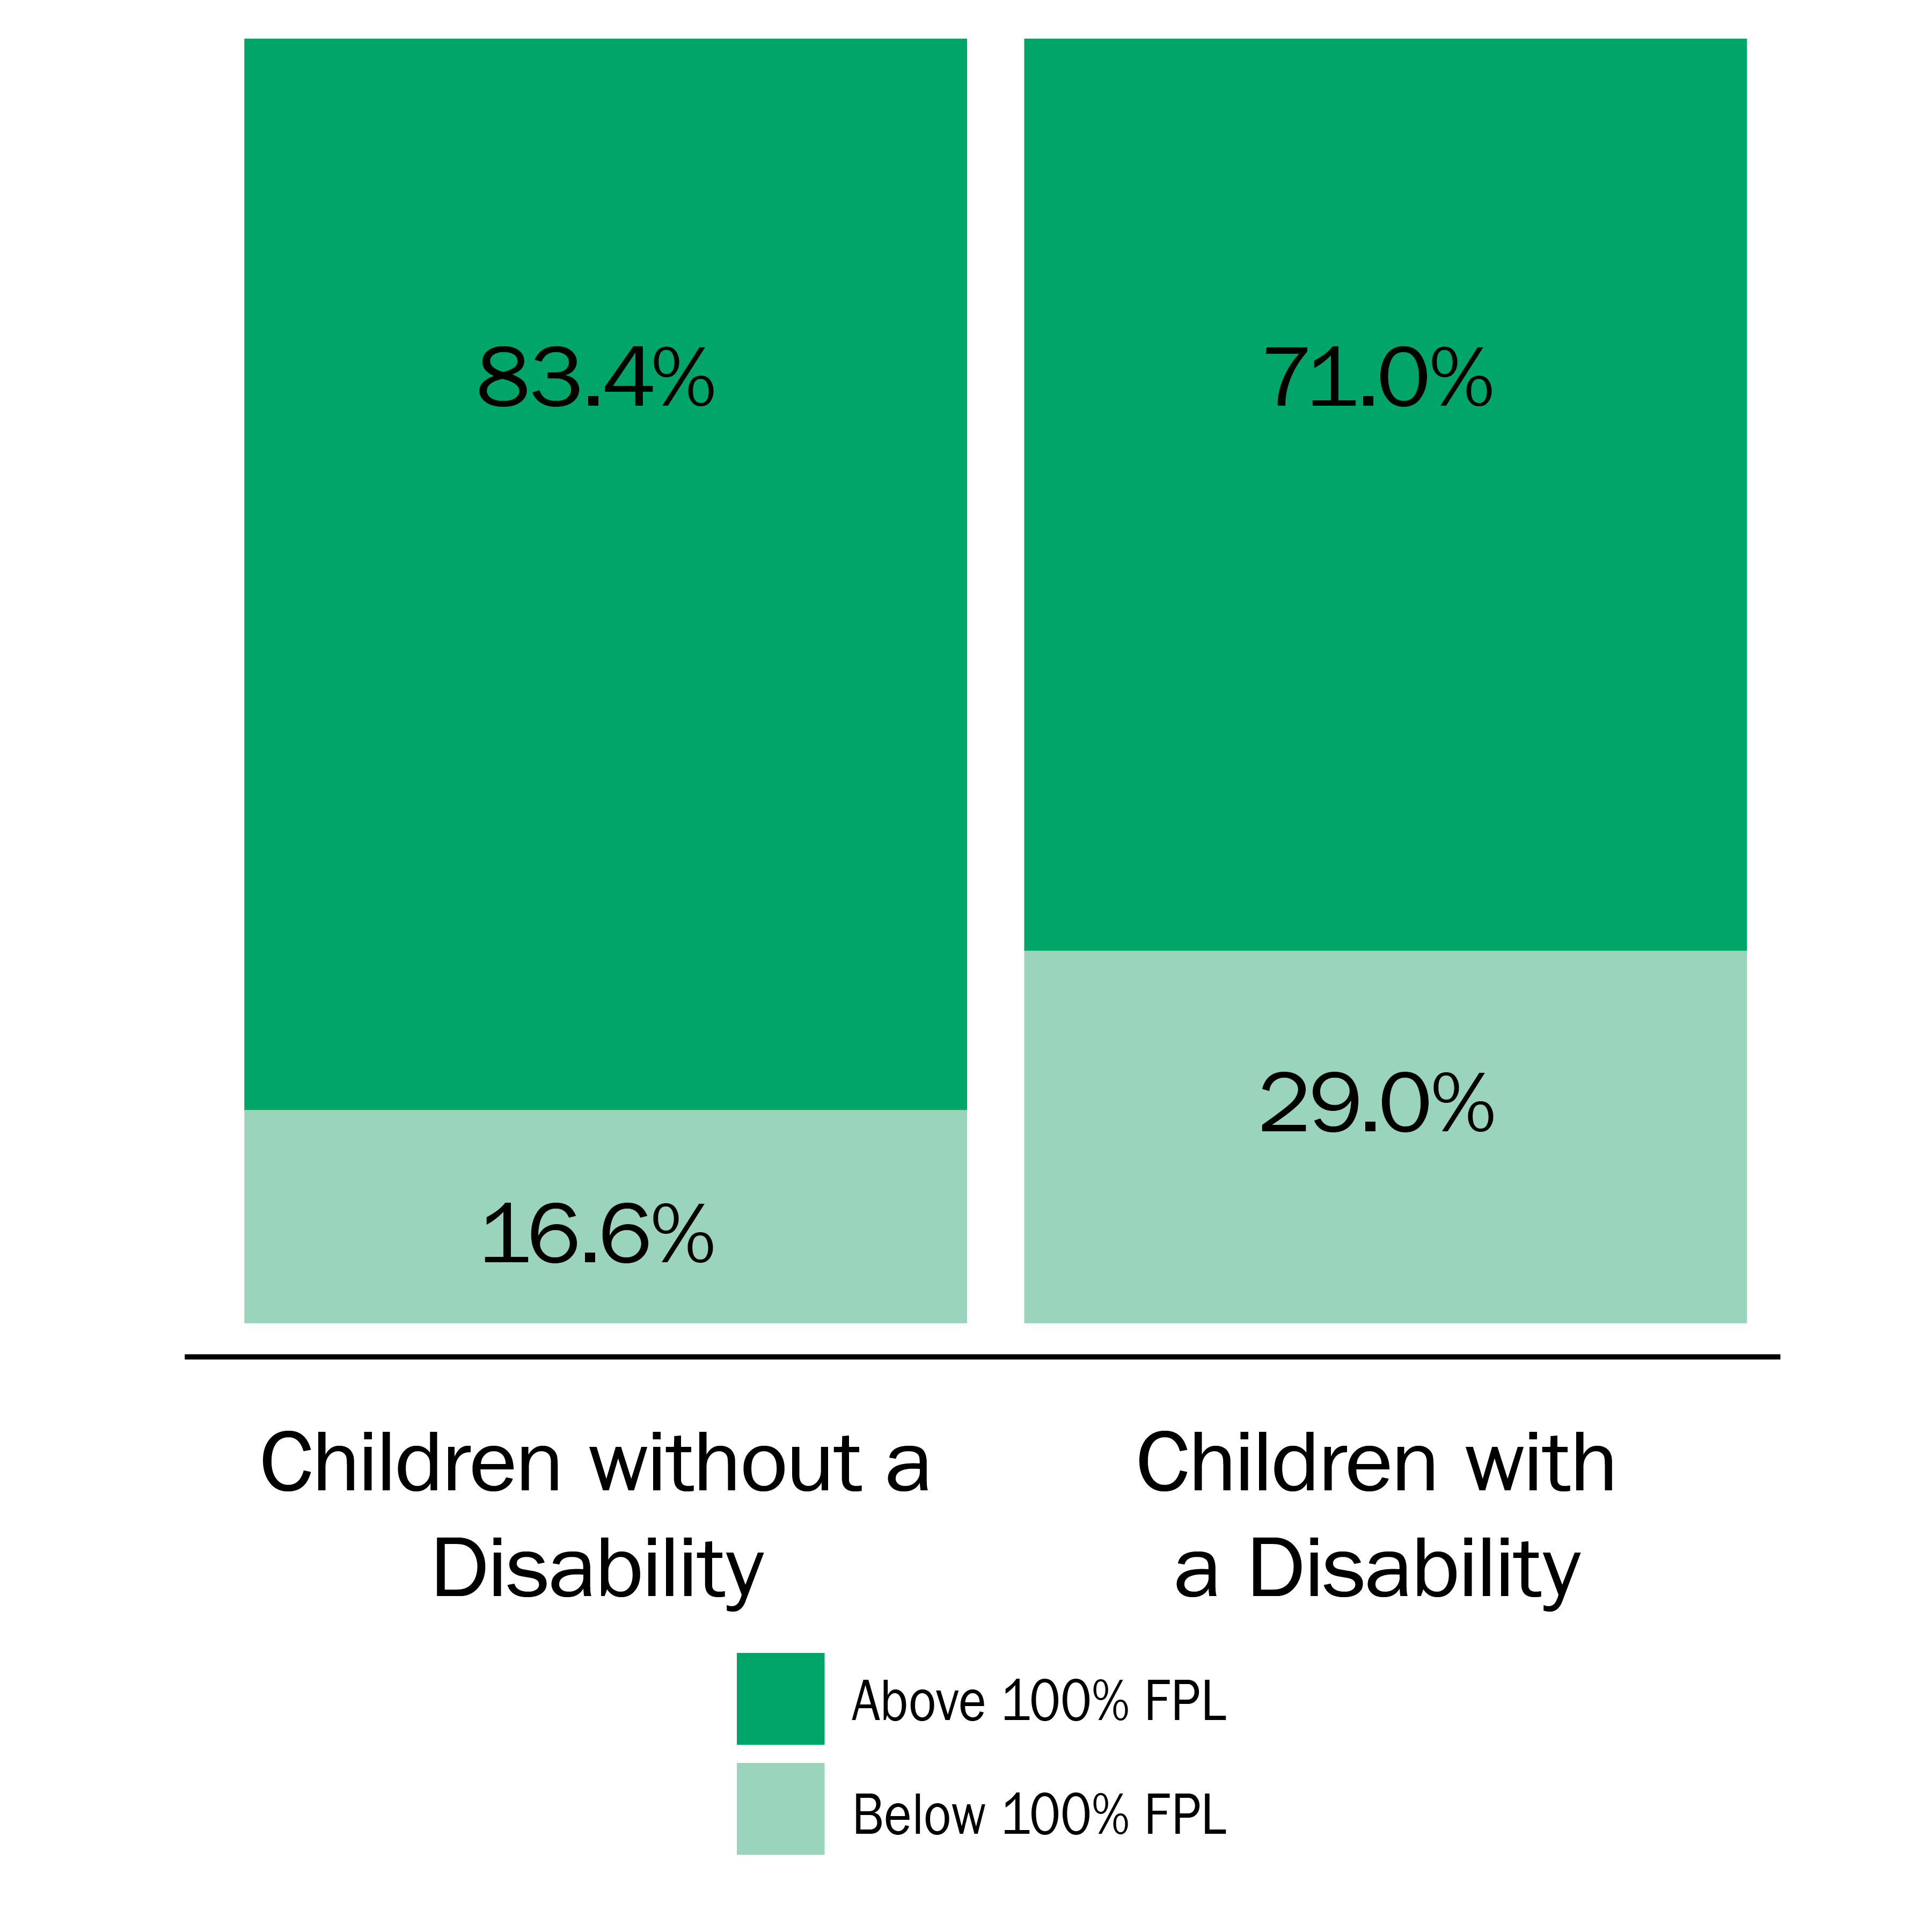
Children living in poverty are diagnosed with a disability at disproportionate rates.22 Poverty is a pervasive barrier and is shown as both a cause and consequence of disability. Children living in poverty have much greater vulnerability to disease, especially during infancy and early childhood. Impoverished families are also less likely to receive adequate health care, or to be able to pay for basic medical needs and other necessary services. The costs of caring for a child with a disability present further economic hardship for families, in many cases necessitating a parent not working or contributing to family income.23
Data show a link between the complexity of a special health care need and the financial strain placed on a family.25 Among Nebraska children with special health care needs, 21.5% of parents of children with less complex and 31.0% with more complex needs cited that they had difficulty paying their children’s medical bills. Unsurprisingly, the families of children with special health care needs show higher rates of out-of-pocket medical expenses compared to their peers without special health care needs.
A child with special health care needs invariably impact the caregivers financial and career decisions. Over 1 in 5 (22.6%) Nebraska parents of children with special health care needs reported their child’s condition caused financial challenges for the family. Caring for a child with special health care needs requires time devoted specifically to their health care needs, 8.9% of parents report spending 11 or more hours per week providing or coordinating their children’s health care. To have the time to care for their children, 17.8% of children with special health care needs had a family member cut back or stop working and 17.2% had a parent avoid changing jobs in order to maintain current health care insurance.26
Children in Poverty (2015)<sup>24</sup>
Effect of Health Condtions on Daily Activities (2016)27
- Consistently Affected, Often a Great Deal (34.0%)
- Moderately Affected Some of the Time (6.3%)
- Never Affected (59.7%)
- Consistently Affected, Often a Great Deal (34.0%)
- Moderately Affected Some of the Time (6.3%)
- Never Affected (59.7%)
Health insurance coverage reduces financial barriers to accessing preventive care and necessary specialist visits. There is no evidence of increased expenditures on health care for children with disabilities based on health insurance coverage status. Parents cite similar amounts of health care utilization for their child with disabilities despite their insurance coverage status. Findings show that having health insurance works to reduce parental out-of-pocket expenditures.28
Out of Pocket Expenses (2016)29
- Children Without Special Health Care Needs
- Children With Less Complex Special Health Care Needs
- Children With More Complex Special Health Care Needs
- Children Without Special Health Care Needs
- Children With Less Complex Special Health Care Needs
- Children With More Complex Special Health Care Needs
Paying Medical Bills (2016)30
- Children Without Special Health Care Needs
- Children With Less Complex Special Health Care Needs
- Children With More Complex Special Health Care Needs
- Children Without Special Health Care Needs
- Children With Less Complex Special Health Care Needs
- Children With More Complex Special Health Care Needs
Education
The Individuals with Disabilities Education Act (IDEA) provides for the services of infants, toddlers, children, and youth with disabilities with the stated purpose:
- “to ensure that all children with disabilities have available to them a free and appropriate public education that emphasizes special education and related services designed to meet their unique needs and prepare them for further education, employment, and independent living;
- to ensure that the rights of children with disabilities and parents of such children are protected;
- to assist states, localities, educational service agencies, and Federal agencies to provide for the education of all children with disabilities;
- to assist states in the implementation of a statewide, comprehensive, coordinated, multidisciplinary, interagency system of early intervention services for infants and toddlers with disabilities and their families;
- to ensure that educators and parents have the necessary tools to improve educational results for children with disabilities by supporting system improvement activities; coordinated research and personnel preparation; coordinated technical assistance, dissemination, and support; and technology development and media services;
- to assess, and ensure the effectiveness of, efforts to educate children with disabilities.” 31
In the 2015/16 school year, Nebraska had 49,508 young people classified as special education, with specific learning disabilities and speech language impairment having the highest prevalence.32
Students Classified as Special Education by Disability (2015/16)33
- Number of Students
- Number of Students
18-24-year old Nebraskans college or graduate school enrollment (2015)34
- Not Enrolled in College or Graduate School (57.7%)
- Enrolled in College or Graduate School (42.3%)
- Not Enrolled in College or Graduate School (57.7%)
- Enrolled in College or Graduate School (42.3%)
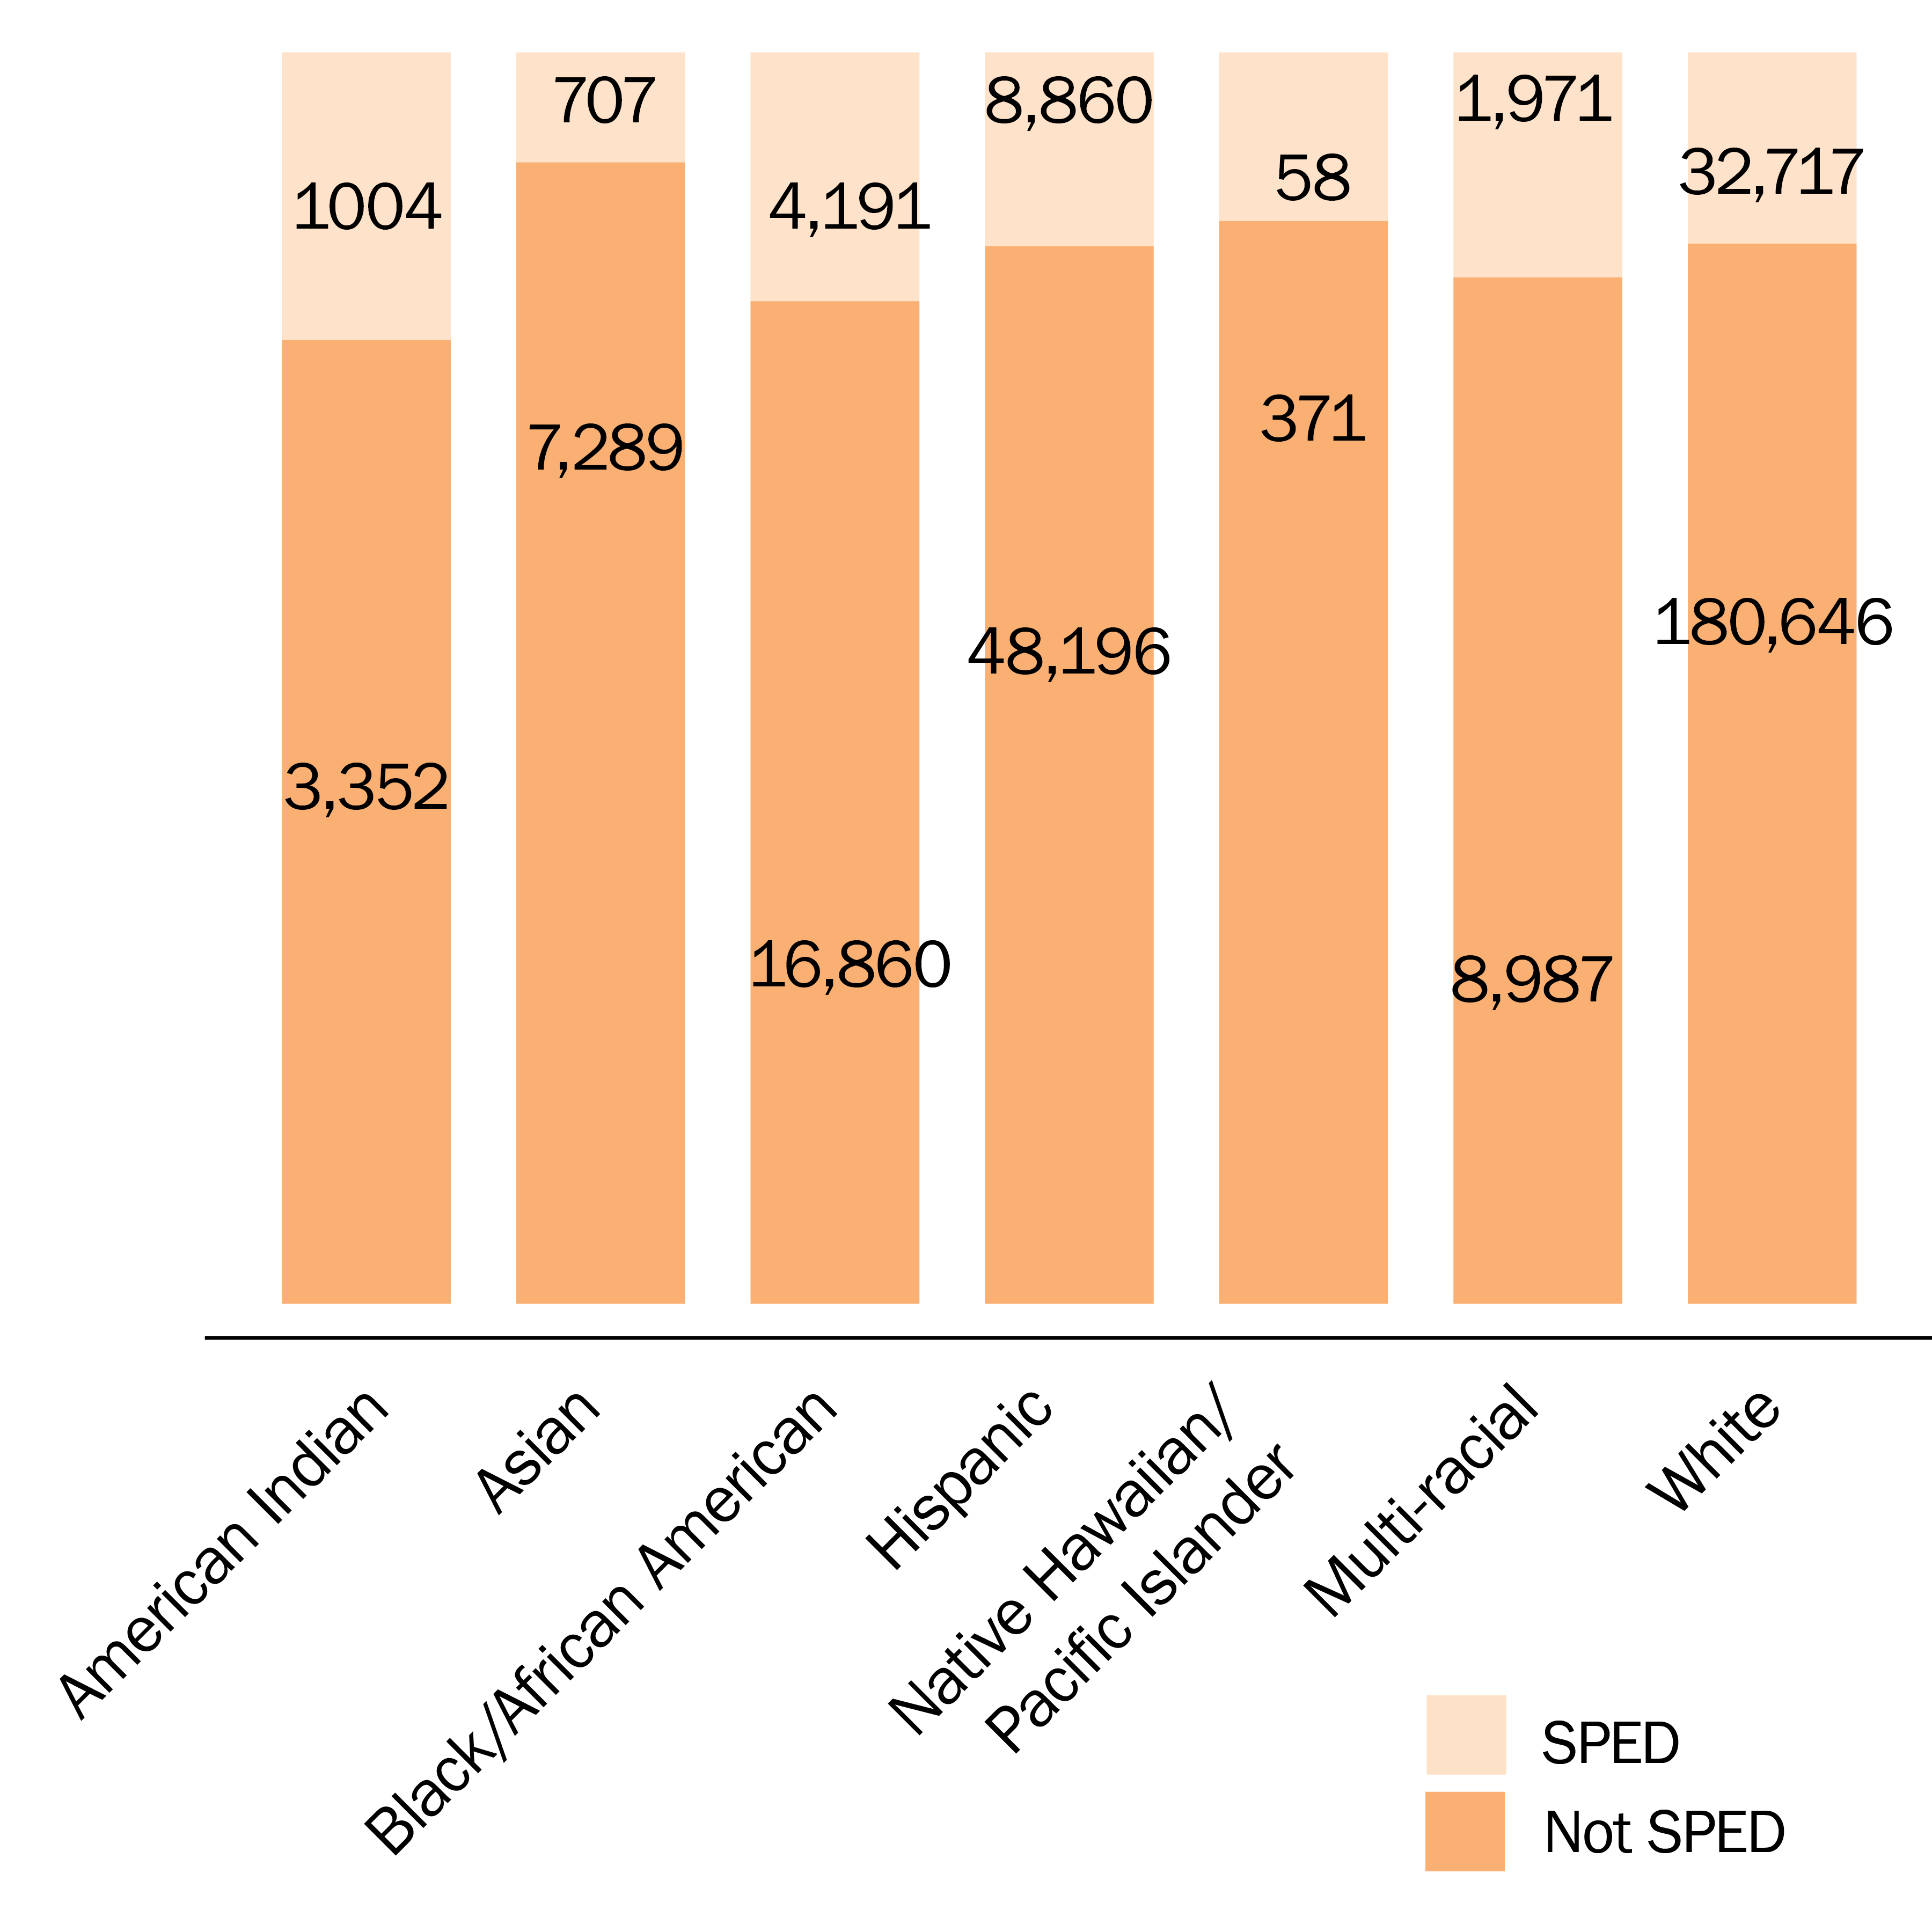
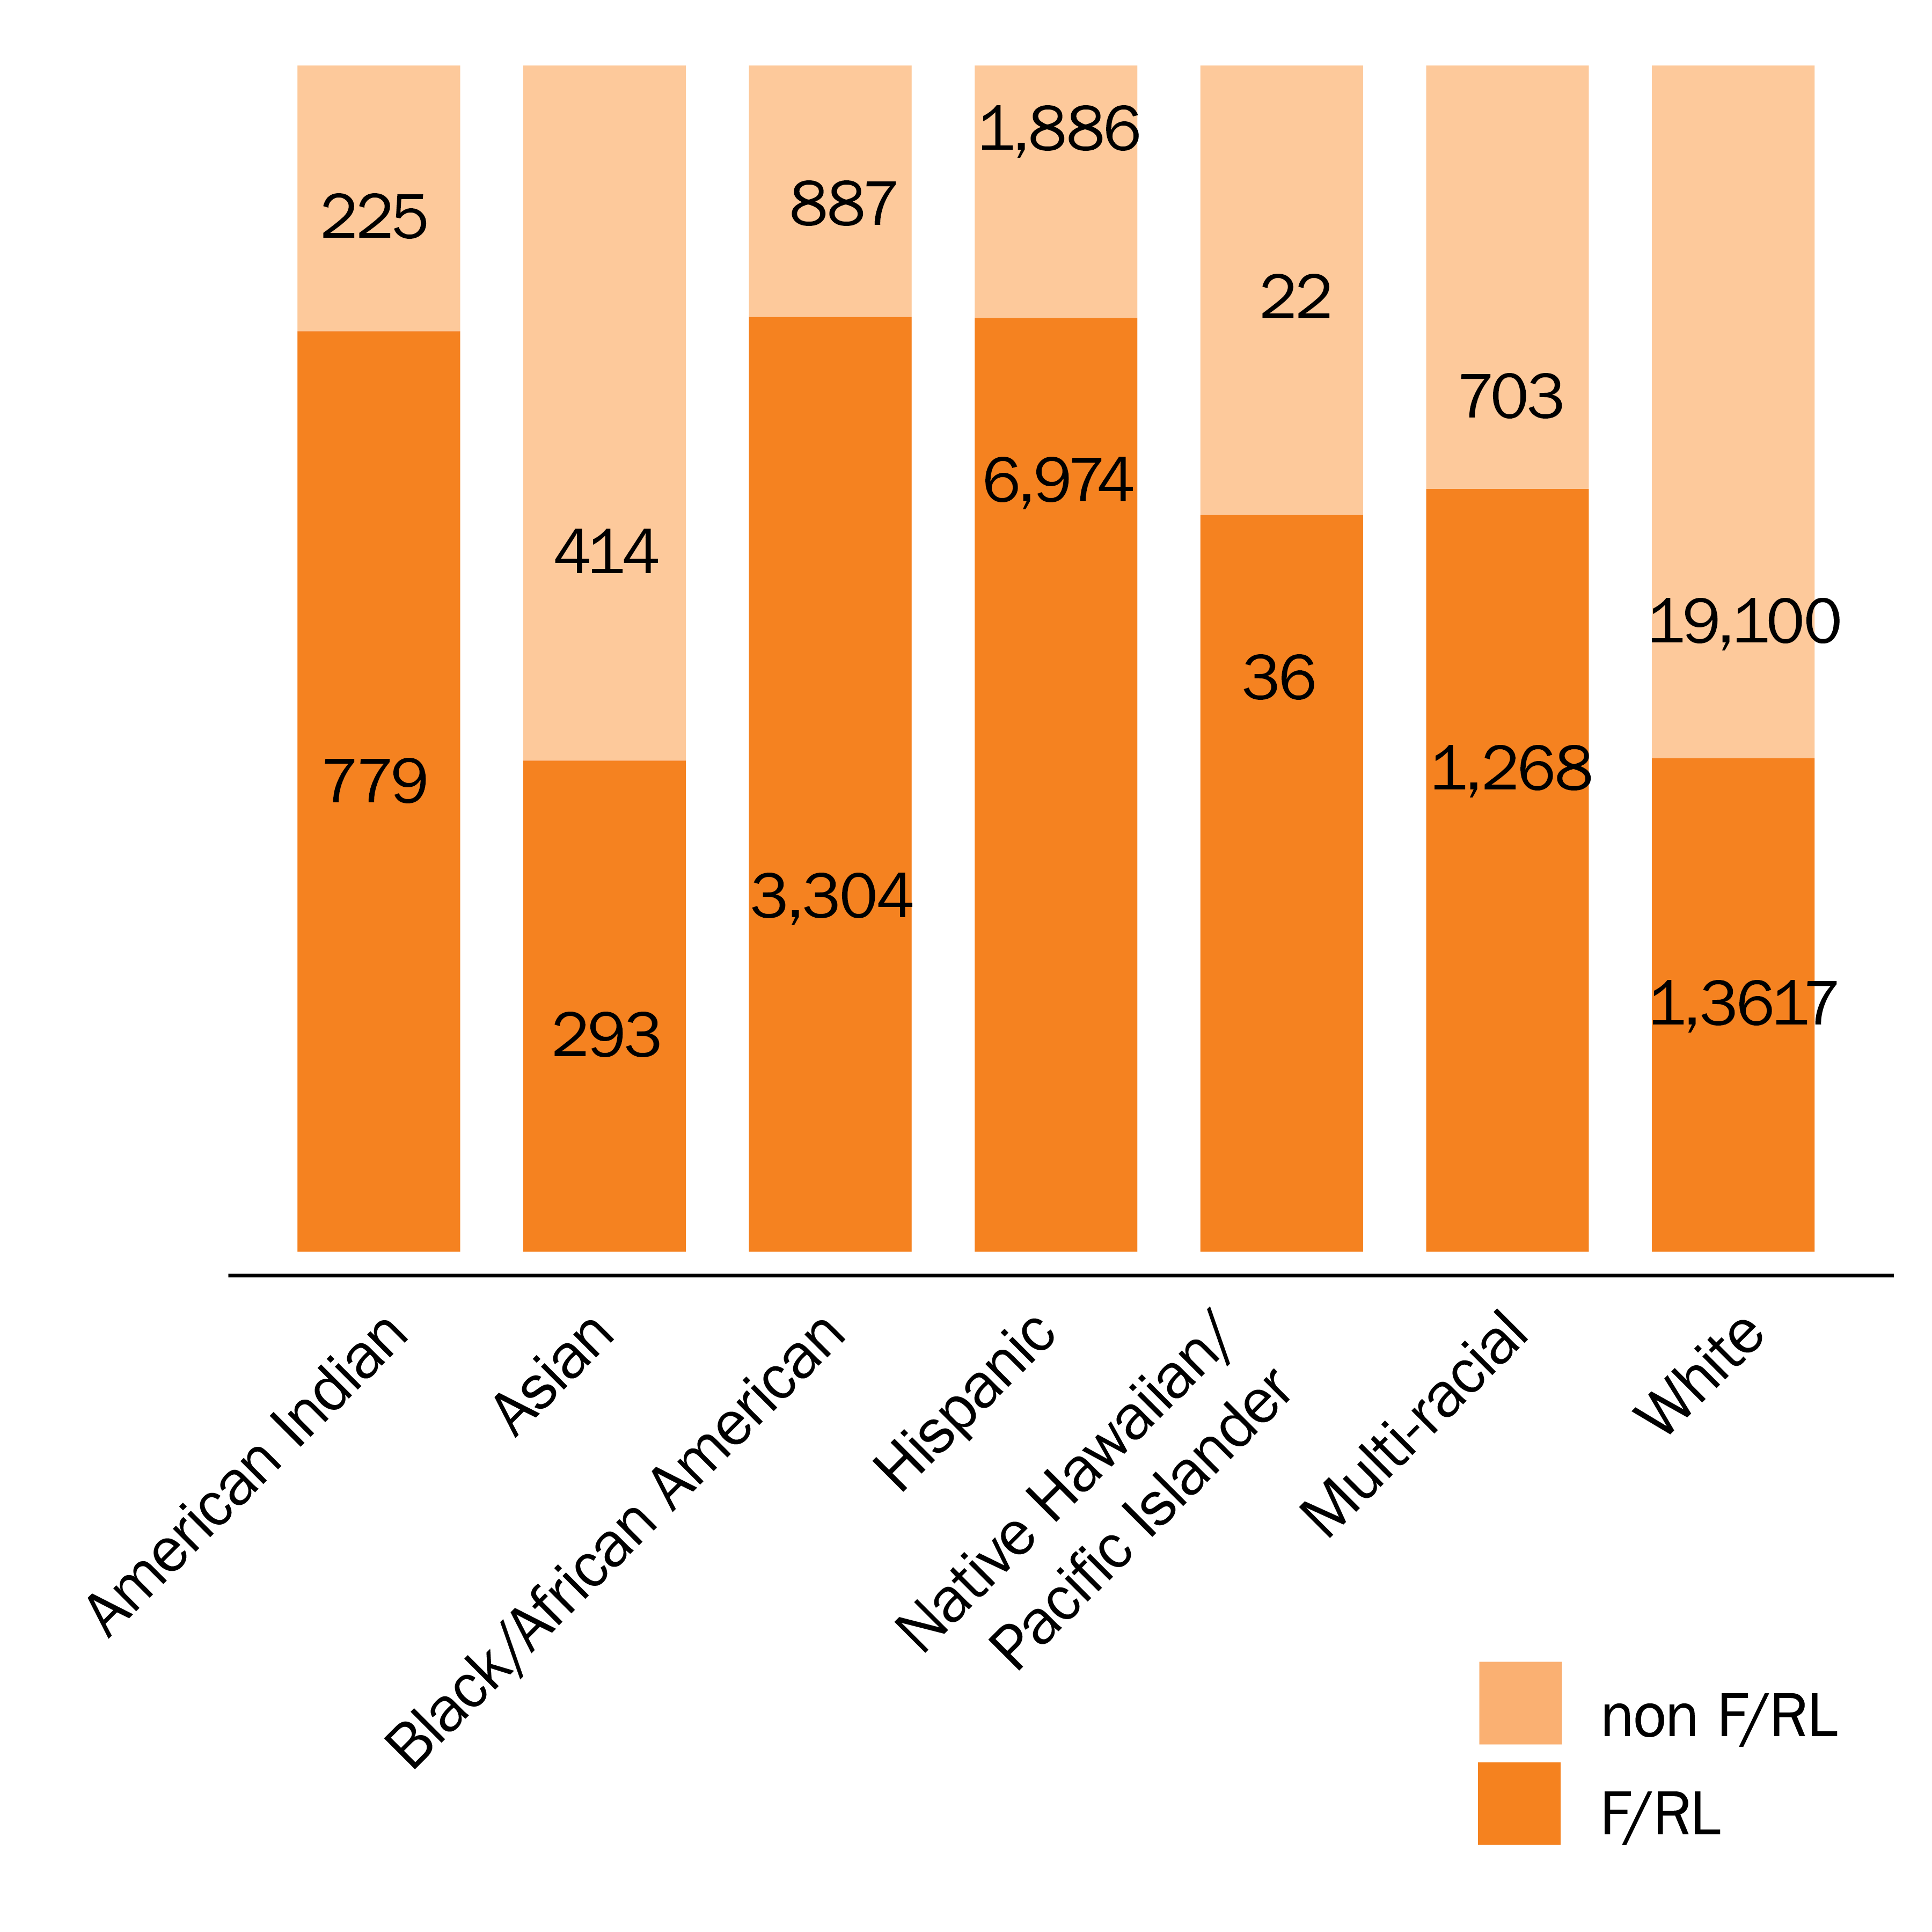
Children of color and low-income children are classified as special education at disproportionate rates. American Indian and Black/African American children have the greatest rate of special education classification, with 23.0% and 19.9% respectively.35 More than half of children in special education qualify for free or reduced lunch, with even higher rates for non-White and non-Asian children.36
Students Classified as Special Education by Race (2015/16 School Year)<sup>37</sup>
Students Classified as Special Education by Race and Free/Reduced Lunch Qualifications (2015/16 School Year)<sup>38</sup>
Research has shown experiencing most of academic instruction within general education is associated with better outcomes for children. Furthermore, IDEA requires qualifying children be educated in the “least restrictive environment” to the maximum extent possible..39 Despite increases in the amount of time students with learning disabilities spend in general education classrooms, the performance of these students continues to lag behind the general student population.
NeSA Reading Proficiency (2015/16)40*
- % Proficiency All Students
- % Proficiency - SPED Students
- % Proficiency All Students
- % Proficiency - SPED Students
NeSA Math Proficiency (2015/16)41*
- % Proficiency All Students
- % Proficiency - SPED Students
- % Proficiency All Students
- % Proficiency - SPED Students
It is estimated that up to 90% of the 6.6 million students in special education nationwide can be fully capable of graduating from high school and prepared for college or a career if they receive proper support along the way.42 In Nebraska, only 70% of special education students graduate in four years, though the rate is near 90% after seven years.43
Graduation Rate 4-7 years (2015/16 School Year)44
Family Support and the Child Welfare System
Raising a child with a disability can be incredibly challenging. It is apparent that families of children with a disability are under significant stress and require numerous community and system supports to help their child grow and develop the best they can and eventually contribute to society. An effective child welfare system works to ensure that children grow up in safe, permanent, and loving homes while strengthening families and minimizing trauma through timely and appropriate action.45 Researchers believe that societal attitudes and lack of knowledge regarding children with disabilities place them at greater risk for abuse and neglect. When considering these increased risks, efforts to prevent and correct maltreatment must be coordinated and multifaceted. Community-level supports must work to embrace children with disabilities as valuable parts of society and promote inclusion of them in everyday life. Families need community supports in connecting to appropriate treatment for their child, training to manage their child’s condition, and a safe space to receive emotional support to help them cope with the unique challenges presented when raising a child with a disability.
The Arc of Nebraska’s 2013 Family Support Project conducted focus groups with the caregivers of Nebraska’s children with intellectual or developmental disabilities. Several themes in system interaction emerged, including:
- Inadequate training: Providers and service coordinators were not well trained and lacked adequate information on programs and the needs of the child and their families. Families also felt they received little training on the care and therapy of their child from medical professionals and providers, resulting in difficulty providing consistent support and care.
- Difficulty in the referral process: Medical professionals often failed to provide needed referrals for infants, the verification process for early childhood services were inconsistent, and program information and referrals were not provided by professionals.
- Respite: Accessing respite for caregivers was difficult and those who failed or were unable to use their respite care allotment were often be deemed ineligible for the service. Problems with respite provider payment were also reported.
- Transportation: Confusion regarding eligibility for transportation services and scheduling were reported. Caregivers also identified that many therapies and other services necessitated traveling long distances, which is costly to families and requires time away from work.
- Medical capacity: Caregivers reported difficulty accessing specialized medical services, especially in rural communities.
- Special education: Children continued to be segregated and isolated from their general education peers, and schools lack necessary supports to serve children in classrooms. Families perceived that Individual Education Plans either were not written or were not being implemented as written.
- System responsiveness: Caregivers reported difficulties with ACCESSNebraska and a gap in access to a service coordinator after the child’s age of three.46
Nebraska ranked 49th in state expenditures for families with a child with an intellectual or developmental disability.47
-
26% of Nebraska children with disabilities were involved in the child welfare system in 2016.
-
19% were in out-of-home care at some point in 2016.
-
11% received in-home care services at some point in 201652,53
The 2009/10 National Survey of Children with Special Health Care Needs identified that:
-
70.7% of Nebraska parents of children with special health care needs report that community-based services are organized so that families can use them easily.
-
71.5% of Nebraska families report having no difficulties or delays in receiving community-based services.
-
92.8% of Nebraska families report they are sometimes or never frustrated in obtaining services.48
Children with disabilities are disproportionately represented in the child welfare system. While they make up only an estimated 3.7% of all Nebraska children,50 44.2% of children involved in the child welfare system have some type of disability diagnosis. This disproportionality is even more exaggerated among children who have been removed from their home.
Percent of U.S. Children with Special Health Care Needs Who Need Family Support Services (2016)49
- % with Unmet Need
- % Who Need Services
- % with Unmet Need
- % Who Need Services
Child Welfare System Involvement51
- Had a Disability
- Did Not Have a Disability
- Had a Disability
- Did Not Have a Disability
Juvenile Justice
School discipline policies have been implemented in recent decades establishing a non-academic interaction between students, schools, and juvenile and criminal justice systems. This interaction is known as the school to prison pipeline, and can start very early for children and adolescents who are classified as special education. An estimated one in three youth who are arrested has a disability, ranging from emotional to learning disabilities, and some researchers estimate the figure may be as high as 70%.54 In the U.S., students with emotional disabilities are three times more likely to be arrested before leaving high school than others in the general population.55 When kids with disabilities end up behind bars, their education can become minimal or non-existent — though federal law requires that they continue to receive an education until age 21.56
2013/14 data from the Office of Civil Rights Data Collection show dramatic disproportionality in rates of public school students with disabilities receiving referral to law enforcement. Overall, 5.0 per 1,000 Nebraska students were referred to the juvenile justice system, but the rate doubled for students with a disability, with 10.0 per 1,000 students receiving a referral. Referrals of students with disabilities comprised 33% of all referrals.57 Without the appropriate diagnosis of a disability and the services that schools must provide, some students are referred to the court simply because their disabilities have not been adequately addressed. To effectively counteract the disproportionate rates of children with disabilities falling into the school to prison pipeline, it is the responsibility of our education system to work to eliminate disparities in discipline practices, create a supportive and nurturing school climate, better train and develop school staff, build partnerships in communities, and engage students and families.58
Conclusion and Recommendations
Disabilities affect thousands of Nebraska children, and we must work to ensure that all children have the tools they need to live a happy, healthy, and fulfilling life and become contributing members of society. State and federal systems are necessary to support people with disabilities and their families.<sup>59</sup> Our systems must ensure that community resources are accessible to support families as their children grow and develop, whether that is assistance with medical expenses, respite care services, specialized healthcare, mental health services, or adequate special education. The data identify many disparate outcomes for children with disabilities, and we should do more as a state to provide the best possible opportunities for children with disabilities and their families. Voices for Children in Nebraska recommends:
- Increased community-based resources and supports available to families including training, counseling, referrals, and respite care. Families and caregivers of children with disabilities have higher needs for services to care for their child. By ensuring our state has adequate access to mental health care, specialized medical care, well trained service coordinators, and a solid network of appropriately trained and compensated respite care providers, caregivers can more effectively coordinate the services their child needs while maintaining their own mental and emotional health.
- Increased community-based resources and supports available to families including training, counseling, referrals, and respite care. Families and caregivers of children with disabilities have higher needs for services to care for their child. By ensuring our state has adequate access to mental health care, specialized medical care, well trained service coordinators, and a solid network of appropriately trained and compensated respite care providers, caregivers can more effectively coordinate the services their child needs while maintaining their own mental and emotional health.
- Protect and preserve Medicaid. Medicaid provides a lifeline for children with disabilities with more than half relying on public insurance coverage to meet the wide range of services and supports their condition requires. Without Medicaid, many children would likely have no health insurance at all. Currently, efforts to cap federal funds for Medicaid are under way. Children with disabilities would be disproportionately impacted by these caps due to their higher usage of medical services, and caps could put their health at risk. Caps on Medicaid would result in children not getting the comprehensive care they need and a loss in services that children with disabilities and their families must depend on.
- Expand early screening and diagnosis procedures. Children’s outcomes can be improved through earlier diagnosis allowing physical and educational interventions to begin sooner. 84% of Nebraska’s children with special health care needs to who require services, did not begin receiving services before age three.<sup>60</sup> Services to young children who have or are at risk for developmental delays have shown to positively impact health, language and communication, cognitive development, and social and emotional development.<sup>61</sup> Identifying need as early as possible allows for services to begin when a child’s brain is most capable of change. Early diagnosis and service reduces incidence of future problems in learning behavior, and health status. Intervention is likely to be more effective, and is less costly, when provided earlier in life.<sup>62</sup>
- Increase funding to schools to exceed “more than de minimis” IDEA requirement. When schools fail to give an individual student the right services and the right support through high school, they not only fail the students, they violate federal law. The IDEA requires that school districts identify students in need of special education services and then provide them a free education that is appropriate for their individual needs. School districts commonly lack the necessary funding to go above and beyond a standard special education curriculum. By ensuring proper diagnosis and timely services, students can be set up with the best possible chance of success. When special education teachers are lacking experience or have too large of caseloads it is impossible to serve student’s with disabilities needs appropriately. Minimizing special education caseloads and allowing teachers the ability to provide greater individualized services leads to better outcomes for children and families.
- Expand wrap-around services for youth who become involved in the juvenile justice system. Youth with disabilities need a wide range of individual supports. Research shows that providing comprehensive services to these youth when they display delinquent behaviors produces positive results. Community-based, family-focused, and prevention-oriented supports need to be in place to prevent and reduce delinquency by both addressing risk factors and building protective factors to insulate children at risk.
Sources
2. UNICEF, Promoting the Rights of Children With Disabilities, 2007, http://www.un.org/esa/socdev/unyin/documents/children_disability_rights.pdf.
3. U.S. Department of Education, Federal Policy Statement on Inclusion of Children with Disabilities in Early Childhood Programs, 2016, http://www.parentcenterhub.org/wp-content/uploads/2016/06/Parent-Center-Presentation-6-23-16.pdf.
4. World Health Organization, Disabilities, http://www.who.int/topics/disabilities/en/.
5. Americans with Disabilities Act of 1990.
Note: For this report “children” will refer to those aged 0-17 years. While Nebraska’s definition of childhood extends to age 19, national data sources do not include 18-year-olds as children, therefore it was impossible to include this year of age in most of the data here.
7. U.S. Census Bureau, 2015 American Community Survey 5-year estimates, Table B18101.
8. U.S. Census Bureau, 2015 American Community Survey 5-year estimates, Table B18101.
9. U.S. Census Bureau, 2015 American Community Survey 5-year estimates, Table B18101B-I.
10. U.S. Census Bureau, 2015 American Community Survey 5-year estimates, Table B18102-B18106.
12. American Academy of Pediatrics, Childhood Disability Rate Jumps 16% Over Past Decade, 2013, https://www.aap.org/en-us/about-the-aap/aap-press-room/pages/Childhood-Disability-Rate-Jumps.asp.
13. American Academy of Pediatrics, Childhood Disability Rate Jumps 16% Over Past Decade, 2013, https://www.aap.org/en-us/about-the-aap/aap-press-room/pages/Childhood-Disability-Rate-Jumps.asp.
14. American Academy of Pediatrics, Childhood Disability Rate Jumps 16% Over Past Decade, 2013, https://www.aap.org/en-us/about-the-aap/aap-press-room/pages/Childhood-Disability-Rate-Jumps.asp.
15. 2016 National Survey of Children’s Health.
16. A special health care need is defined by the federal Maternal and Child Health Bureau as a child having a current health consequence due to medical, behavioral, or other type of health condition that has lasted or is expected to last at least a year. Due to lack of data on children with a disability diagnosis this classification must be used for some data points on the population of Nebraska children experiencing special, long-lasting health conditions.
18. 2016 National Survey of Children’s Health.
19. Szilagyi, P., Health Insurance and Children with Disabilities, The Future of Children, Princeton-Brookings, 2012.
20. U.S. Census Bureau, 2015 American Community Survey 5-year estimates, Table B18135.
21. 2016 National Survey of Children’s Health.
23. UNICEF, Promoting the Rights of Children with Disabilities, 2007, http://www.un.org/esa/socdev/unyin/documents/children_disability_rights.pdf.
24. U.S. Census Bureau, 2015 American Community Survey 5-year estimates, Table C18130.
25. 2016 National Survey of Children’s Health.
26. 2009/2010 National Survey of Children with Special Health Care Needs.
27. 2016 National Survey of Children’s Health.
28. Szilagyi, P., Health Insurance and Children with Disabilities, The Future of Children, Princeton-Brookings, 2012.
29. 2016 National Survey of Children’s Health.
30. 2016 National Survey of Children’s Health.
32. Nebraska Department of Education.
35. Nebraska Department of Education.
36. Nebraska Department of Education.
37. Nebraska Department of Education.
38. Nebraska Department of Education.
39. National Center for Learning Disabilities, The State of Learning Disabilities, 2014, https://www.ncld.org/wp-content/uploads/2014/11/2014-State-of-LD.pdf.
41. 2015/16 Nebraska Education Profile, Nebraska Department of Education.
42. The Hechinger Report, Almost all students with disabilities are capable of graduating on time. Here’s why they’re not, 2017, http://hechingerreport.org/high-schools-fail-provide-legally-required-education-students-disabilities/.
43. Nebraska Department of Education.
44. Nebraska Department of Education.
*NeSA proficiency rates shown here are for students who take the standard NeSA test, with or without accommodations.
46. The Arc of Nebraska, Report of the Nebraska 2013 Family Support Survey, http://dhhs.ne.gov/developmental_disabilities/Documents/Family%20Supports%20Project%20Report%205-14.pdf.
48. 2009/2010 National Survey of Children with Special Health Care Needs.
49. 2009/2010 National Survey of Children with Special Health Care Needs.
50. U.S. Census Bureau, 2015 American Community Survey 5-year estimates, Table B18101.
51. Nebraska Department of Health and Human Services.
52. Nebraska Department of Health and Human Services.
53. U.S. Census Bureau, 2015 American Community Survey 5-year estimates, Table B18101.
55. The Hechinger Report, Pipeline to Prison: Special education too often leads to jail for thousands of American Children, 2014, http://hechingerreport.org/pipeline-prison-special-education-often-leads-jail-thousands-american-children/.
56. The Hechinger Report, Pipeline to Prison: Special education too often leads to jail for thousands of American Children, 2014, http://hechingerreport.org/pipeline-prison-special-education-often-leads-jail-thousands-american-children/.
57. U.S. Department of Education, Office of Civil Rights, Civil Rights Data Collection, 2013/14 State and National Estimations.
58. National Education Association, Discipline and the School-To-Prison Pipeline, 2016.
59. The Arc, Position Statements, Systems Summary.
60. 2016 National Survey of Children’s Health.
61. The National Early Childhood Technical Assistance Center, The Importance of Early Intervention for Infants and Toddlers with Disabilities and Their Families, 2011.
62. Center for the Developing Child at Harvard University, The Foundations of Lifelong Health are Built in Early Childhood, 2010, https://developingchild.harvard.edu/resources/the-foundations-of-lifelong-health-are-built-in-early-childhood/.

