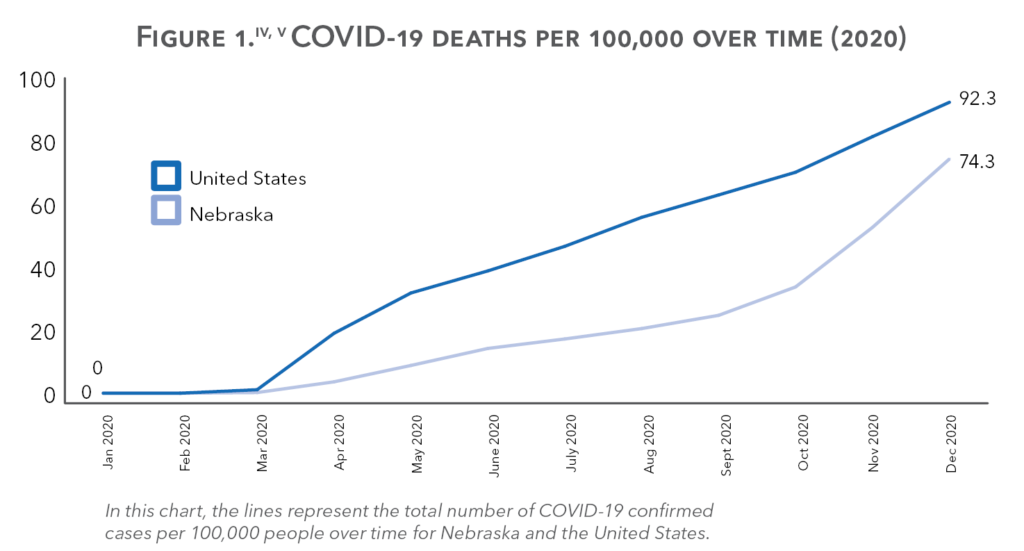
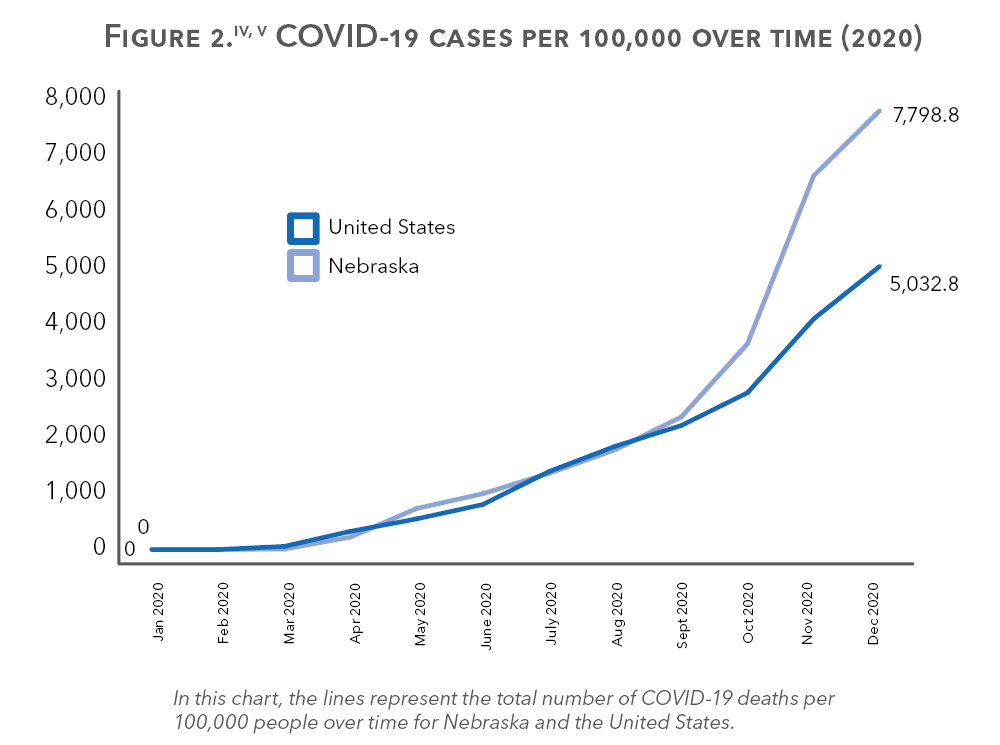
Healthy and financially stable individuals who have equitable access to opportunity are the foundation of a thriving community. This year—2020—was a year of worldwide turmoil, uncertainty, and reckoning. A novel airborne disease, COVID-19, took nations by surprise and froze their economies, claimed the lives of their citizens, and transformed the way people work, study, meet, and live. According to John Hopkins University, the United States was among the hardest hit nations both in terms of mortality and infection rates by the end of the year.i In the U.S., Nebraska ranked number 5 in total cases per capita as of mid-December 2020.ii COVID-19 had infected more than 165,000 Nebraskans, hospitalized nearly 5,000, and taken the lives of over 1,500 residents, including some children.iii By the year’s end, the number of cases and deaths continued to rise (See Figure 1 and 2).iv, v The economic impact has also been devastating. Since the pandemic began, 11% of Nebraskans with children have reported sometimes or often not having enough to eat, 41% have reported loss of income, and 19% have reported having slight or no confidence in affording next month’s home payment.vi Children and families have also experienced an increase in stress that can impact mental health. Two thirds (66%) of parents have reported feeling down or anxious, up from 41% in 2019.vi, vii School systems increased their reliance on remote learning highlighting inequities in access to technology. Around 1 in 20 Nebraskans with children reported rarely or never having a computer or internet available for educational purposes, making remote learning virtually impossible for thousands of kids.vi As staggering as they may be, these statistics do not and cannot capture the depth of the pain and struggle of Nebraskan families, nor can they predict the road ahead.
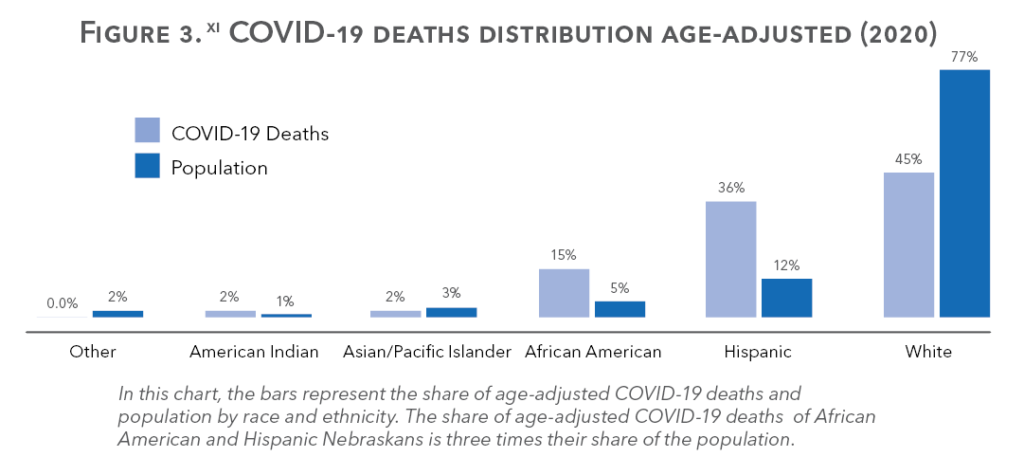
COVID-19 has been most damaging to older populations. As of mid-December, COVID-19 had accounted for 11.3% of all deaths in the U.S. among people over the age of 65, compared to 3.9% of all deaths among people under the age of 45.viii The risk of severe illness from COVID-19 is increased for adults with certain underlying medical conditions, including cancer, obesity, sickle cell disease, and pregnancy.ix During the early stages of the pandemic, the rate of infection was highest among people living in concentrated urban areas, but it has now spread across rural communities.x COVID-19 has also taken a devastating and disproportionate toll on communities of color throughout the nation and across Nebraska. Although White people accounted for the majority (84%) of all COVID-19 deaths in Nebraska by the end of the year, the share of deaths, once adjusted for age, was overrepresented by Hispanics and African Americans (See Figure 3).xi While Hispanics and African Americans only make up 17% of the Nebraska population, they accounted for more than half of the age-adjusted COVID-19 deaths by mid-December 2020.xi When haphazard diseases discriminate between populations across insubstantial differences, such as race and ethnicity, then the driving underlying condition is not medical but social and systemic. This is the experience of communities of color living in a country where the predominant culture reinforces white supremacy—the social, economic, and political systems that stem from the belief that white people constitute a superior race and that enable white people to maintain power over others.xii While 2020 brought once-in-a-century health and economic crises throughout the globe, people and families of color across Nebraska have experienced constant pandemic-like crises that have been exacerbated by COVID-19.
The results of various analyses using data from the U.S. Census Bureau, the U.S. Bureau of Labor Statistics, and the Centers for Disease Control and Prevention indicate three key conclusions:
- In Nebraska, the overall experiences of families of color prior to the pandemic have been more dire than what White families experienced during 2020.
- Since the pandemic, families of color have fared worse in Nebraska than many families in other states.
- In Nebraska, families of color have experienced worse economic and health outcomes due to the pandemic compared to White families.
Families of Color and the Pandemic
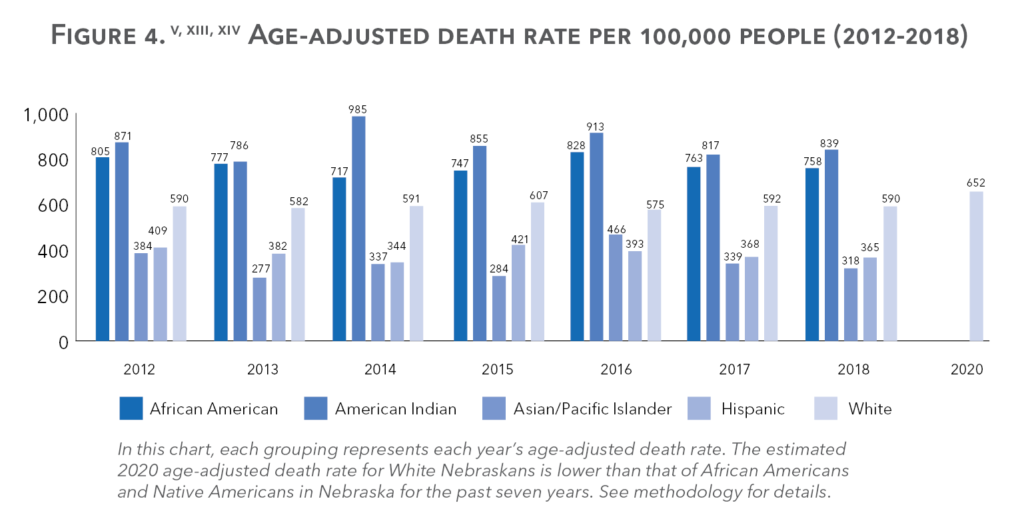
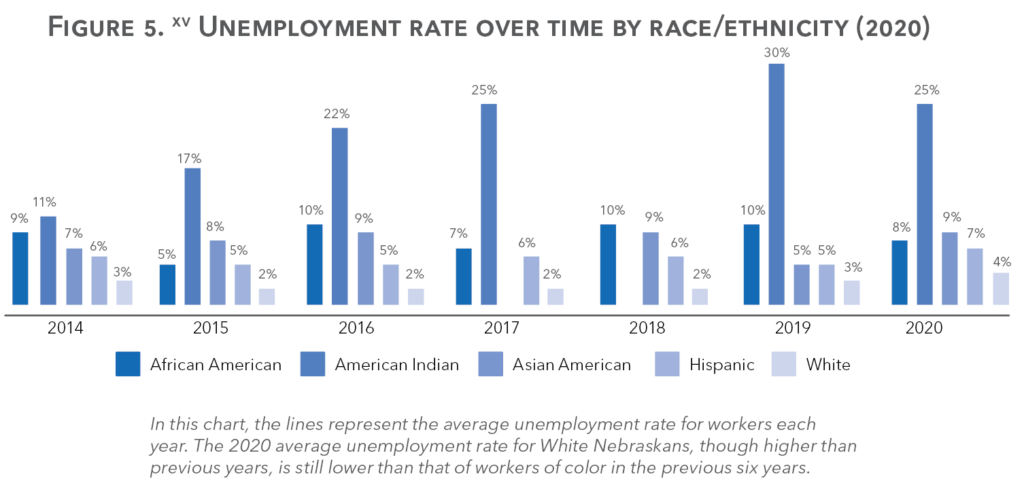
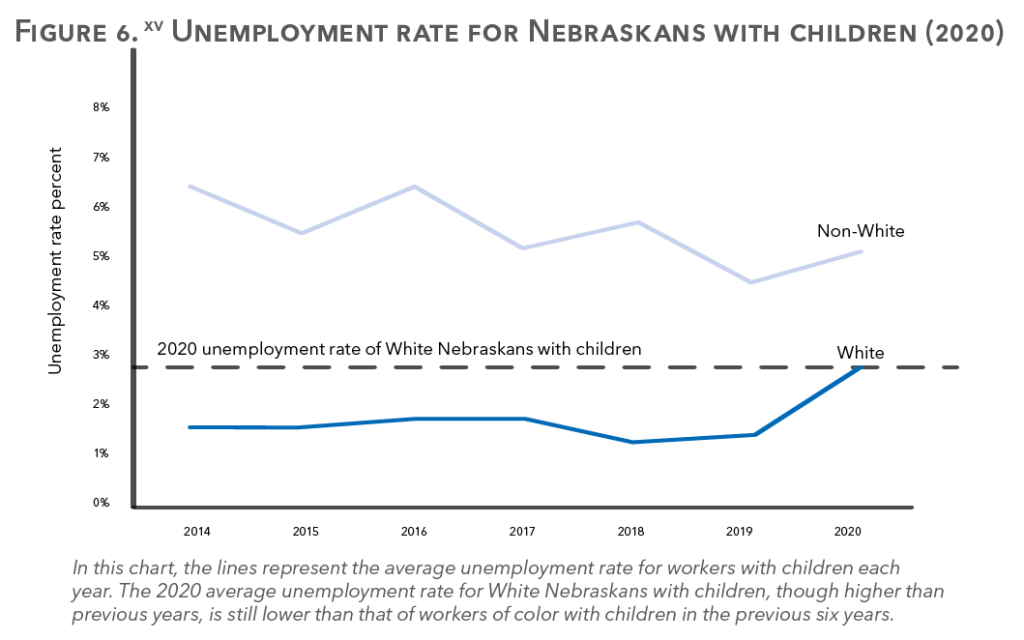
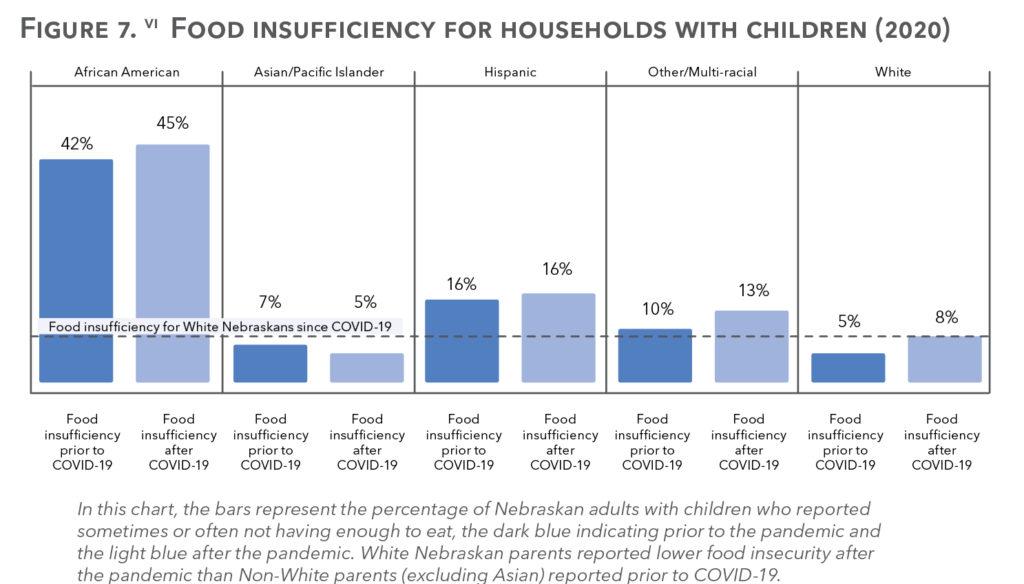
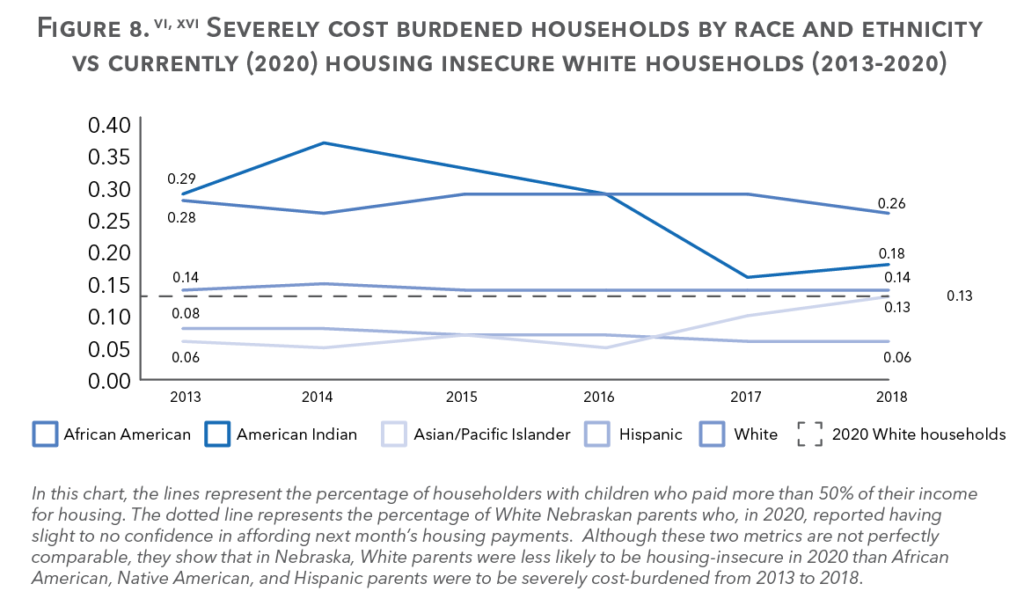
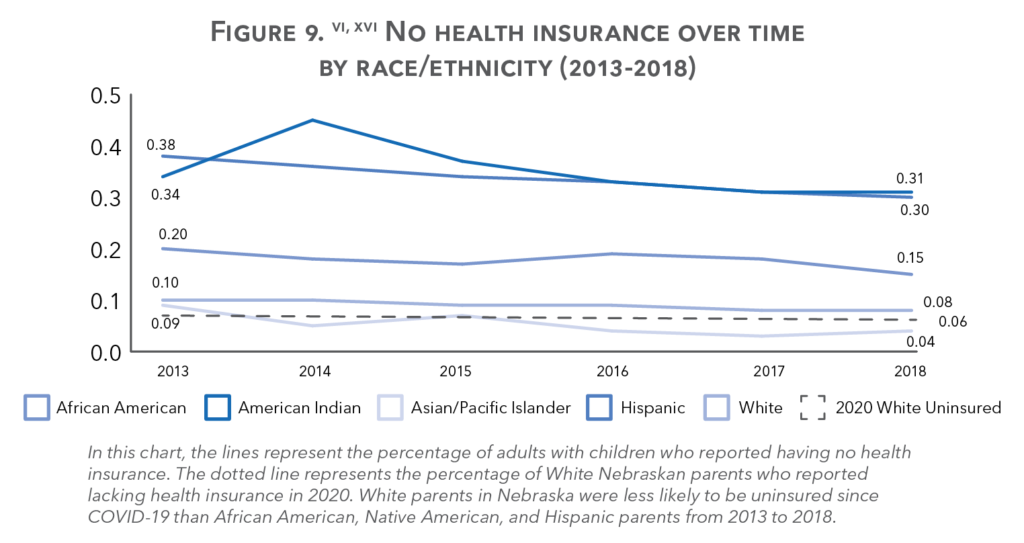
What Nebraskan families of color experienced in 2020 is not unlike what they experienced in previous years. Even with the higher death rates caused by COVID-19, the estimated 2020 age-adjusted death rate for White Nebraskans, for example, is far below that of African American and Native American Nebraskans from previous years (See Figure 4).v, xiii, xiv Despite the high unemployment rates caused by the pandemic, the unemployment rate of White workers and families in 2020 was still much lower than that of non-White workers and families before COVID-19 (See Figure 5 and 6).xv Even with the record food and housing insecurity and the lack of health insurance caused by the economic crisis, White families fared better in 2020 than non-White families in previous years. While 8% of White Nebraskan families have reported food insufficiency since the beginning of the pandemic, 42% of African American families and 16% of Hispanic families in Nebraska have reported food insufficiency prior to the pandemic (See Figure 7).vi Though 13% of White families reported slight or no confidence in affording next month’s housing payment in 2020, a much higher rate of African American, Native American, and Hispanic households with children were severely cost burdened in previous years, meaning that more than 50% of their income went towards housing (See Figure 8).vi, xvi The same can be said about lack of health insurance; more African American, Hispanic, and American Indian families in Nebraska lacked health insurance in previous years than White Nebraskan families did in 2020 (See Figure 9).vi, xvi
Nebraskan Families of Color Compared to Families in Other States
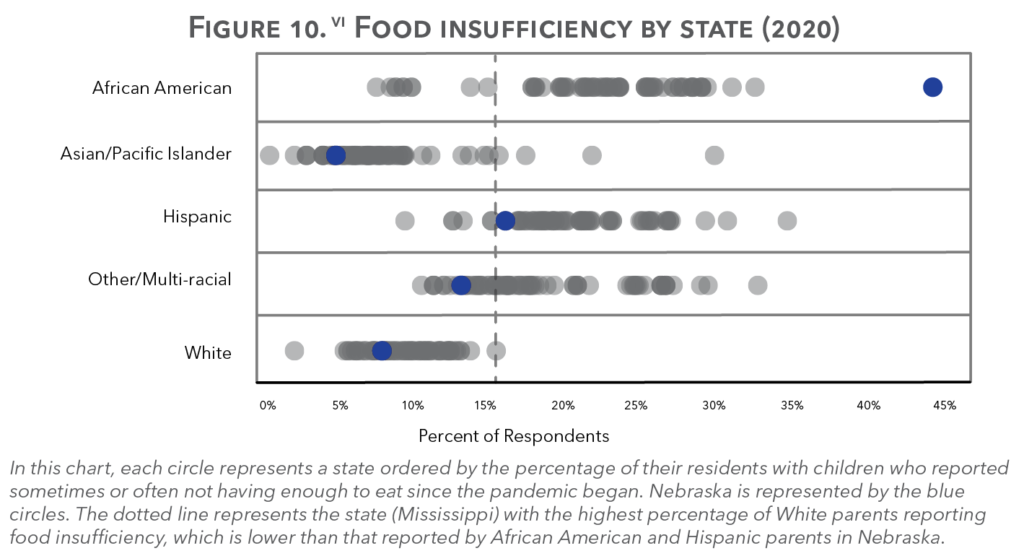
Because of the relatively small sizes of the communities of color in Nebraska, the challenges facing families of color in the state are often overshadowed by the experiences of White families who make up the majority of the population. For example, Nebraska ranked #9 in overall child well-being and #4 in economic well-being in the Annie E. Casey Foundation 2020 Kids Count Profile.xvii In addition, in the COVID-19 Kids Count Policy Report, Nebraska tied as #5 for lowest food insufficiency and #9 in lowest housing insecurity among adults with children.xviii However, when the outcomes are compared by state and broken down by race and ethnicity, it becomes apparent that families of color fare worse in Nebraska than families in other states. While Nebraska tied at #5 for lowest percentage of adults who reported food insufficiency in the COVID-19 Kids Count Policy Report, for instance, Nebraska ranked last (#50) among African American families by a margin of 12 percentage points (See Figure 10).vi Out of all 50 states, Mississippi had the highest percentage of White parents who reported food insufficiency (15.8%); still it is lower than that reported by Hispanic parents (16.4%) and African American parents (44.9%) in Nebraska (See Figure 10).vi
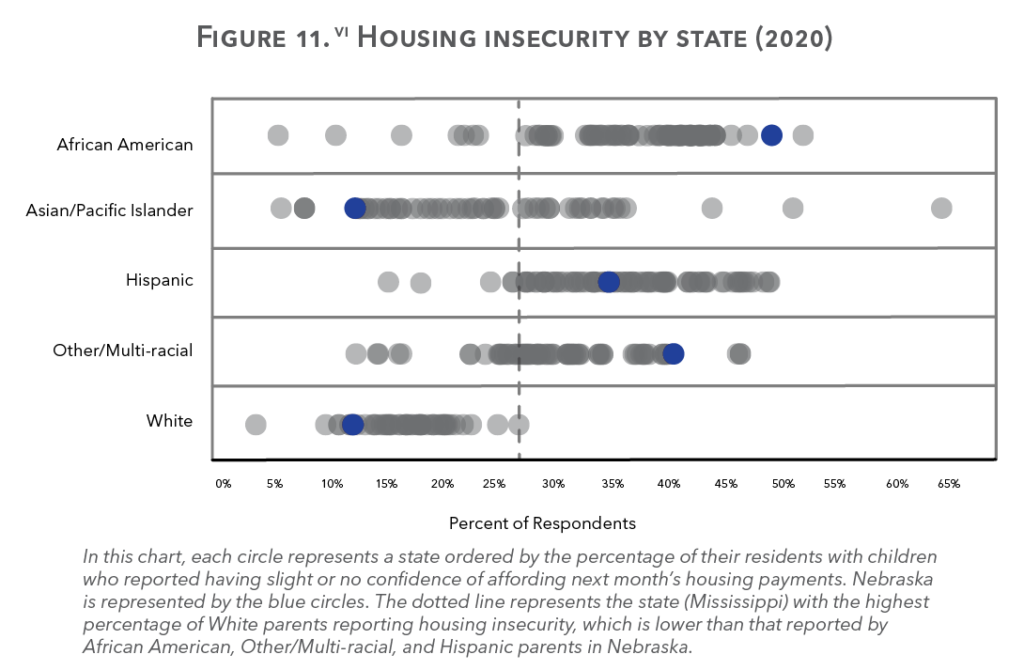
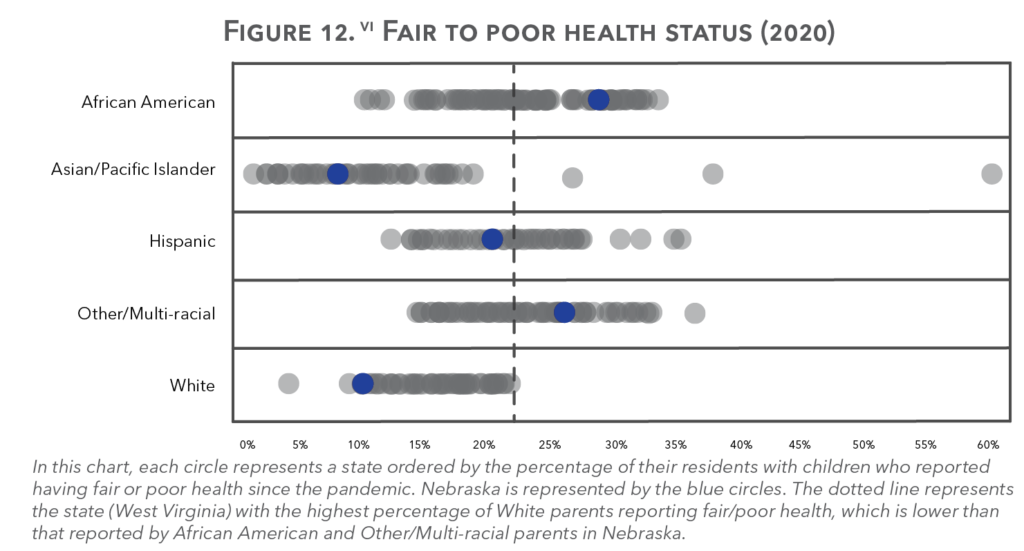
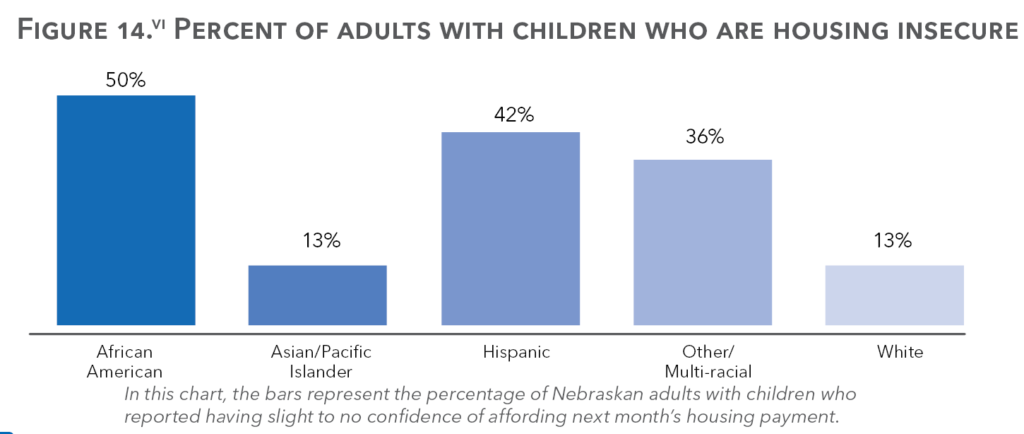
Similarly, while Nebraska ranked #9 in lowest percentage of adults reporting housing insecurity in the COVID-19 Kids Count Policy Report, Nebraska ranked #49 among African American families and #47 among Other/Multi-racial families (See Figure 11).vi Out of all states, Mississippi had the highest percentage of White parents reporting housing insecurity (27.7%), which is lower than the percentage of Hispanic (35.6%), African American (50%), and Other/Multi-racial parents (41.5%) in Nebraska who reported uncertainty about affording housing (See Figure 11).vi A similar trend appears for parents reporting having fair or poor health; 22.3% of White parents in West Virginia (the state with the highest percentage of White parents reporting fair or poor health) compared to 28.8% of African American parents and 26.2% of Other/Multi-racial parents in Nebraska (See Figure 12).vi
Families of Color Compared to White Families in Nebraska
Although significant disparities between racial and ethnic groups have always been prevalent, they have been exacerbated by the pandemic. Compared to White Nebraskan parents:
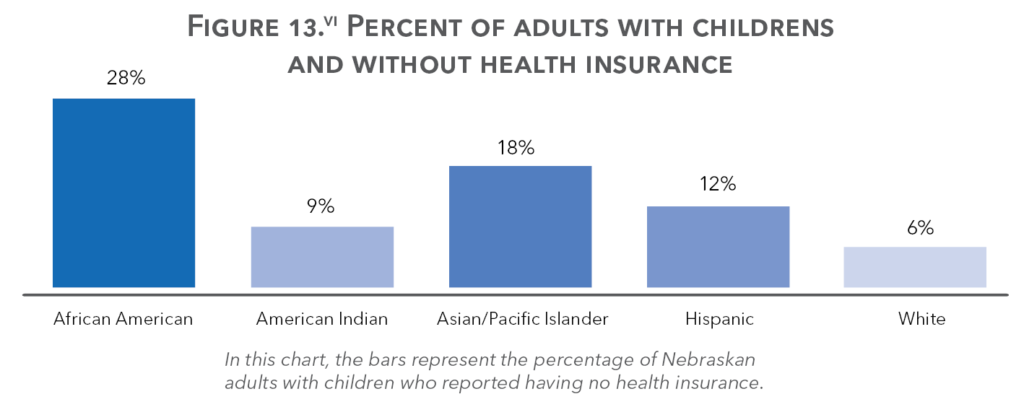
- African American parents were 3.8 times more likely to report housing insecurity, 4.7 times more likely to report lacking health insurance, and 5.6 times more likely to report food insufficiency.<sup>vi</sup>
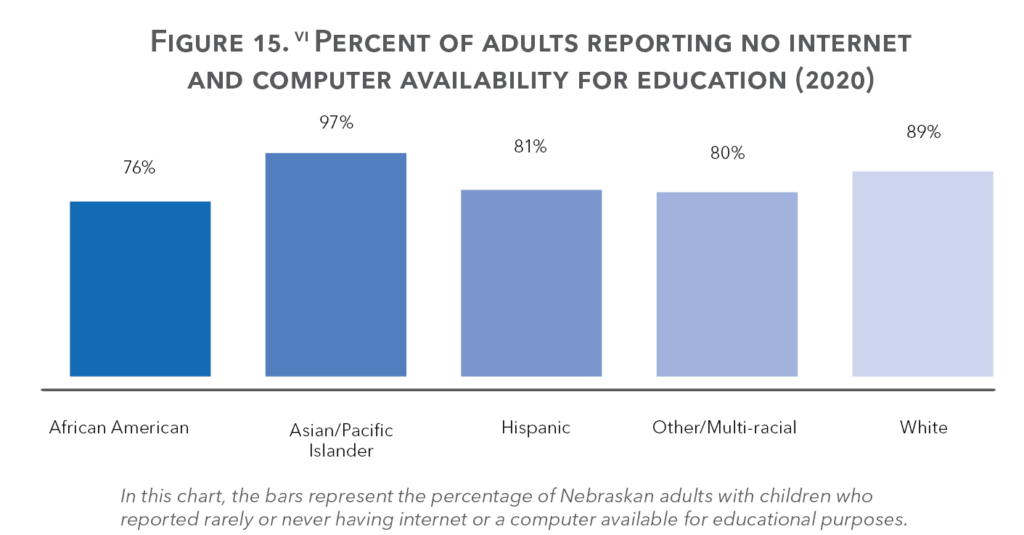
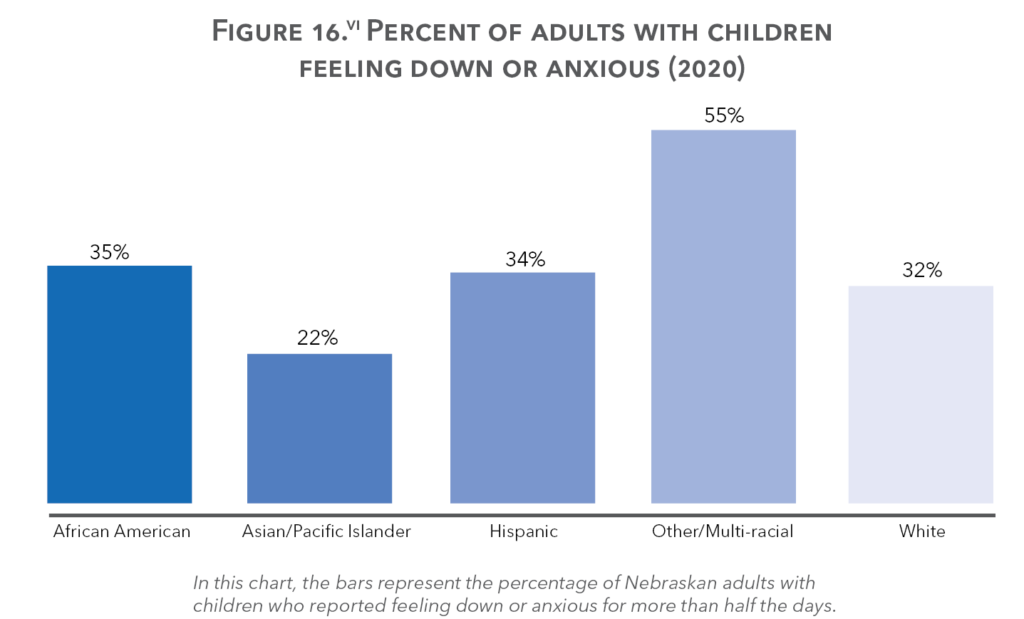
- Other/Multi-racial parents were 3.2 times more likely to report housing insecurity, 2.8 times more likely to report rarely or never having a computer or internet available for educational purposes, and 1.7 times more likely to report feeling down or anxious more than half the days.<sup>vi<s/up>
- Hispanic parents were three times more likely to report not having health insurance, 2.8 times more likely to report housing insecurity, and 2.2 times more likely to report rarely or never having a computer or internet available for educational purposes.<sup>vi</sup>
This past year brought a lot of uncertainty and difficulty to families across Nebraska and all over the world. As the new year begins with new hopes of widespread vaccination against COVID-19, it is important to continue fighting for a solution against the underlying conditions that propels disproportionate outcomes for communities and families of color. These statistics show the effects of the global health pandemic and how they are exacerbated when compounded with the social conditions established by a white supremacy culture in the United States. Social constructs like white supremacy are even harder to address than the COVID-19 pandemic since the illness is ideological, not biological. In order to foster a Nebraska where all children can thrive, we must work to urgently reform the systems that continue to perpetuate trauma and injustice. Similar to the effort put forth by health care professionals to defeat COVID-19, it will take tremendous and deliberate effort by policymakers, educators, and individuals to address the inequities and injustices for families of color.
We empathize with all the lives lost to the global pandemic and we stand in solidarity with the families who have lost loved ones due to racial violence, including George Floyd, Breonna Taylor, Ahmaud Arbery, and James Scurlock. Black Lives Matter.
Recommendations:
- Disaggregate data by race and ethnicity. Data that is not disaggregated masks inequities for communities of color and limits the ability of state leaders to direct resources where they are needed most.
- Require racial impact statements on policy changes. Racial impact statements should be considered as part of any new policy proposals to determine the likely impact for different communities and to work toward addressing systemic biases in our current policies and programs.
- Leverage and expand access to state and federal programs. Programs like SNAP (Supplemental Nutrition Assistance Program), also known as food stamps, and child care assistance provide essential economic support to families to help them meet basic needs and work toward financial stability. Federal, state and local officials should work to make these programs more accessible and available to help families recover from the pandemic.
- Enact policies that ensure that families can continue to balance health needs and employment. Policies like mandatory earned sick days and paid family and medical leave ensure that families can remain financially stable during an acute health crisis. They also protect individual and public health now and into the future.
- Increase access to mental health services. Ensuring that mental health services are widely available and affordable is an essential component in supporting children and families as they recover from a time of unprecedented challenges. More public support of mental health infrastructure is needed to ensure that Nebraska is prepared to address emerging and ongoing mental health needs.
Figures 1 and 2
The number of cases and deaths reported by the CDC iv were as of December 15, 2020. These daily numbers were divided by the total estimated population of the United States and Nebraskav and multiplied by 100,000.
Figure 3
The age-adjusted COVID-19 deaths distribution was calculated by the CDCxi as of December 17, 2020. The figure shows the age-adjusted deaths and the unweighted distribution of the population.
Figure 4
The total number of deaths of White Nebraskans, according to the CDC data set used xiv, were from February 1st, 2020 to December 5th, 2020. It is important to note that according to the CDC, these numbers do not represent all deaths that occurred in that period, because the reporting process can last from one week to eight weeks or more. With this in mind, we assume that the deaths reported in this dataset are an estimate of those that occurred in the 10-month period between February and November. Using estimated White Nebraskan population from 2010 to 2019v, we forecasted an estimate for the White population or 2020 by age groups. Using these forecasted estimates, we calculated the crude 2020 death rate (from February through November) of each of these age groups. To estimate the age-adjusted death rate for this time period, we weighted the age groups using the 2000 U.S. Standard Million. Using mortality data from the Wonder CDC Data Portal,xiii we followed this same methodology to estimate the age-adjusted death rates by race and ethnicity for February through November of 2012 to 2018.
Figure 5
Using the Current Population Survey dataxv, the average annual unemployment rate for all workers by race and ethnicity was calculated by averaging all the months with unemployment data available. If a racial/ethnic group had fewer than four months of data for any given year, it was given a null value. Instead, the average between the previous year’s unemployment rate and the following year’s unemployment rate was calculated to create a continuum between the years but greyed out to indicate insufficient data.
Figure 6
Using the Current Population Survey dataxv, the average annual unemployment rate for workers who reported having at least one own child in the household grouped by White and Non-White was calculated by averaging all the months with unemployment data available. Neither of the groups had fewer than four months of data for any given year.
Figures 7, 10-16
Using data from the U.S. Census Bureau’s Household Pulse Surveyvi from weeks one to 18 (April 23rd to November 9th), these estimates were calculated for respondent who reported having at least one person under 18-years-old in the household.
- Food insufficiency prior to COVID-19 is defined as those respondents who reported sometimes or often not having enough to eat prior to March 13, 2020. Food insufficiency after COVID-19 is defined as those respondents who reported sometimes or often not having enough to eat for the last seven days
- Housing insecurity is defined as those respondents who reported having slight or no confidence of affording next month’s mortgage or rent payments.
Having no internet or computer for educational purposes is defined as those respondents who reported rarely or never having either a computer or internet for educational purposes. - Feeling down or anxious for more than half the days is defined as those respondents who reported either feeling anxious or down during the previous seven days for either more than half the days or nearly every day.
- No health insurance coverage is defined as those respondents who marked “No” to all health insurance coverage options: 1) Health care through a current or former employer or union (including through another family member); 2) Direct purchase rom an insurance company, including marketplace coverage; 3) Medicare; 4) Medicaid, Medical Assistance, or any kind of government-assistance plan; 5) TRICARE or other military health care; 6) Veterans Affairs (VA); 7) Indian Health Coverage; and 8) Other.
- Fair or poor health status is defined as those respondents who reported their general health status as either fair or poor.
Figure 8
Using the IPUMS USA 5-year estimates data from 2013 to 2018xvi, we calculated the percentage of householders with at least one own child in the household who reported paying having a household income of less than twice their housing payments. For comparison, we added the percentage of White adults with children who reported having slight or no confidence in affording next month’s rent or mortgage payments in the 2020 Household Pulse Survey.vi
- For renters, housing payments are defined as their gross monthly rental cost multiplied by 12. These include the cost of the housing unit, utilities, and fuel costs
- For homeowners, housing payments are defined as the derived sum of monthly payments for owner-occupied units multiplied by 12. These include any debts on the property (e.g. mortgage, deeds of trust, etc.); real estate taxes; fire, hazard, and flood insurance; utilities; and fuels.
Figure 9
Using the IPUMS USA 5-year estimates data from 2013 to 2018xvi, we calculated the percentage of householders with at least one own child in the household who reported having no health insurance. For comparison, we added the percentage of White adults with children who reported having no health insurance in the 2020 Household Pulse Survey.vi
BRFSS
The percentage of parents who reported feeling down or anxious in 2019 is defined as those respondents from Nebraska with children in the 2019 BRFSS Surveyvii who reported having one or more days in the past 30 days when their mental health was not good (including stress, depression, and problems with emotions).

