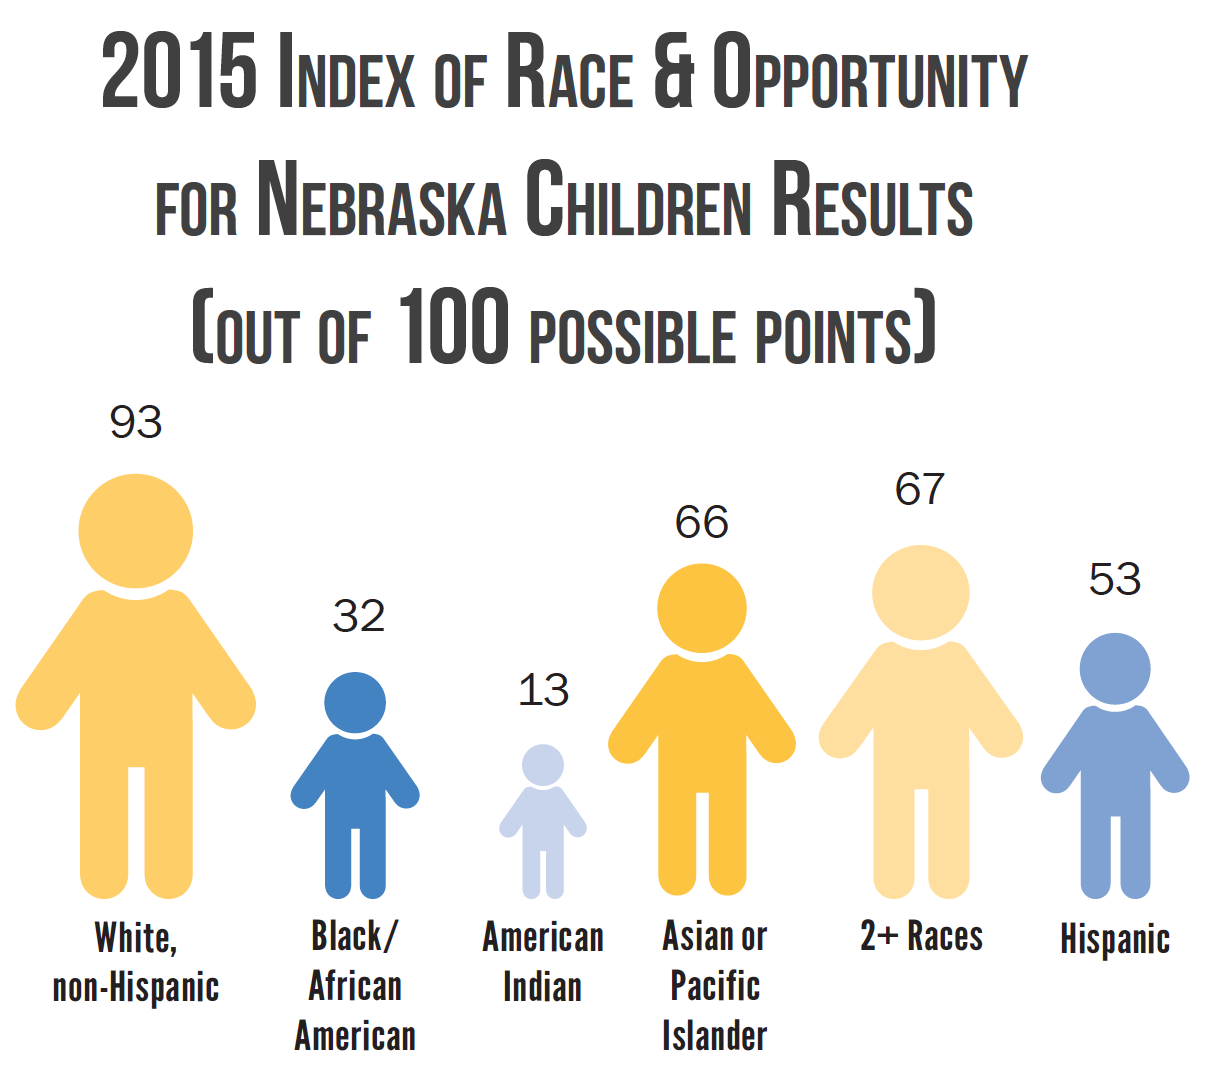
Nebraska was founded under values of opportunity and equality for all, but when looking at the data and research on Nebraska’s children and families, a harsher reality is uncovered– one of disparity and lack of equitable chance of future success and opportunity for children of color. In response to this, the Index of Race & Opportunity for Nebraska Children was created. A composite score of 13 indicators of child well-being was calculated to highlight disparities in opportunity and measure progress toward race equity and inclusion.

7 key steps
Used to help advance and embed race equity and inclusion at all levels of policy creation
Step 1
Establish an understanding of race equity and inclusion principles.
Step 2
Engage affected populations and stakeholders.
Step 3
Gather and analyze disaggregated data.
Step 4
Conduct systems analysis of root causes of inequities.
Step 5
Identify strategies and target resources to address root causes of inequities.
Step 6
Conduct race equity impact assessment for all policies and decision-making.
Step 7
Continuously evaluate effectiveness and adapt strategies.
Indicators used include:
Health
- Children with health insurance coverage
- Infants receiving adequate prenatal care
Education
- 3- and 4-year-olds enrolled in school
- Reading proficiently at 3rd grade
- 16-24-year-olds employed or attending school
Economic Stability
- Children living above the Federal Poverty Level
- Median family income
- Children living in a low-poverty areas
Juvenile Justice
- Youth who have completed a diversion program successfully
- Youth who have completed probation successfully
Child Welfare
- Children not involved in the child welfare system
- Children who are wards of the state, but are living at home
- Children who are living in out-of-home care, but have done so in 3 or fewer placements
Children with health insurance coverage (2014)1
Infants receiving adequate prenatal care (2015)2
3- and 4-year-olds enrolled in school (2014)3
3rd graders reading proficiently (2015)4
16-24-year-olds in school or
employed (2014)5
1. U.S. Census Bureau, 2014 American Community Survey 5-year estimates, Tables C27001B-I.2. Vital Statistics, Department of Health and Human Services (DHHS).
3. U.S. Census Bureau, 2014 American Community Survey 5-year estimates, Public Use Microdata Samples.
4. Nebraska Department of Education.
5. U.S. Census Bureau, 2014 American Community Survey 5-year estimates, Public Use Microdata Samples.
Children living above the federal poverty
line (2014)1
Median family income (2015)2
Children living in areas that are low
poverty (2014)3
1. U.S. Census Bureau, 2014 American Community Survey 5-year estimates, Tables B17001B-I.
2. U.S. Census Bureau, 2014 American Community Survey 5-year estimates, Tables B19113B-I.
3. U.S. Census Bureau, 2014 American Community Survey 5-year estimates, Tables B17001B-I.
Youth successfully completing diversion (2015)1
Youth successfully completing probation (2015)2
Children not involved in the child welfare system [Rate/1,000] (2015)3
State Wards receiving in-home
services (2015)3
Children with three or fewer out-of-home placements (2015)3
2. Office of Probation Administration.
3. Department of Health and Human Services (DHHS)

