Why does it matter?
A good education begins early. Access to high-quality early childhood and pre-kindergarten programs provide an important foundation for children as they move through their school years and into adulthood.
Children who are well educated are much more likely to become successful adults. Higher education is linked to higher income, higher job satisfaction, lower divorce rates, and lower crime rates. By ensuring that all children have access to high-quality educational opportunities and closing the opportunity gap we are investing in the future of our communities, our state, and our economy.
Additional supports for educationally vulnerable children— such as special education, English language learning programs, and quality alternative education programs— help ensure that children with varying needs keep pace.
84%
of Nebraska 3rd graders
score proficient or better in reading.
89%
of Nebraska high school students
graduated on time.
Head Start/Early Head Start
6,378
children were served by Head Start (ages 3-5) and Early Head Start (ages birth-3) in 2016.
125 pregnant women were served by Early Head Start in 20165.
Counties served by Head Start or Early Head Start grantees (2016)
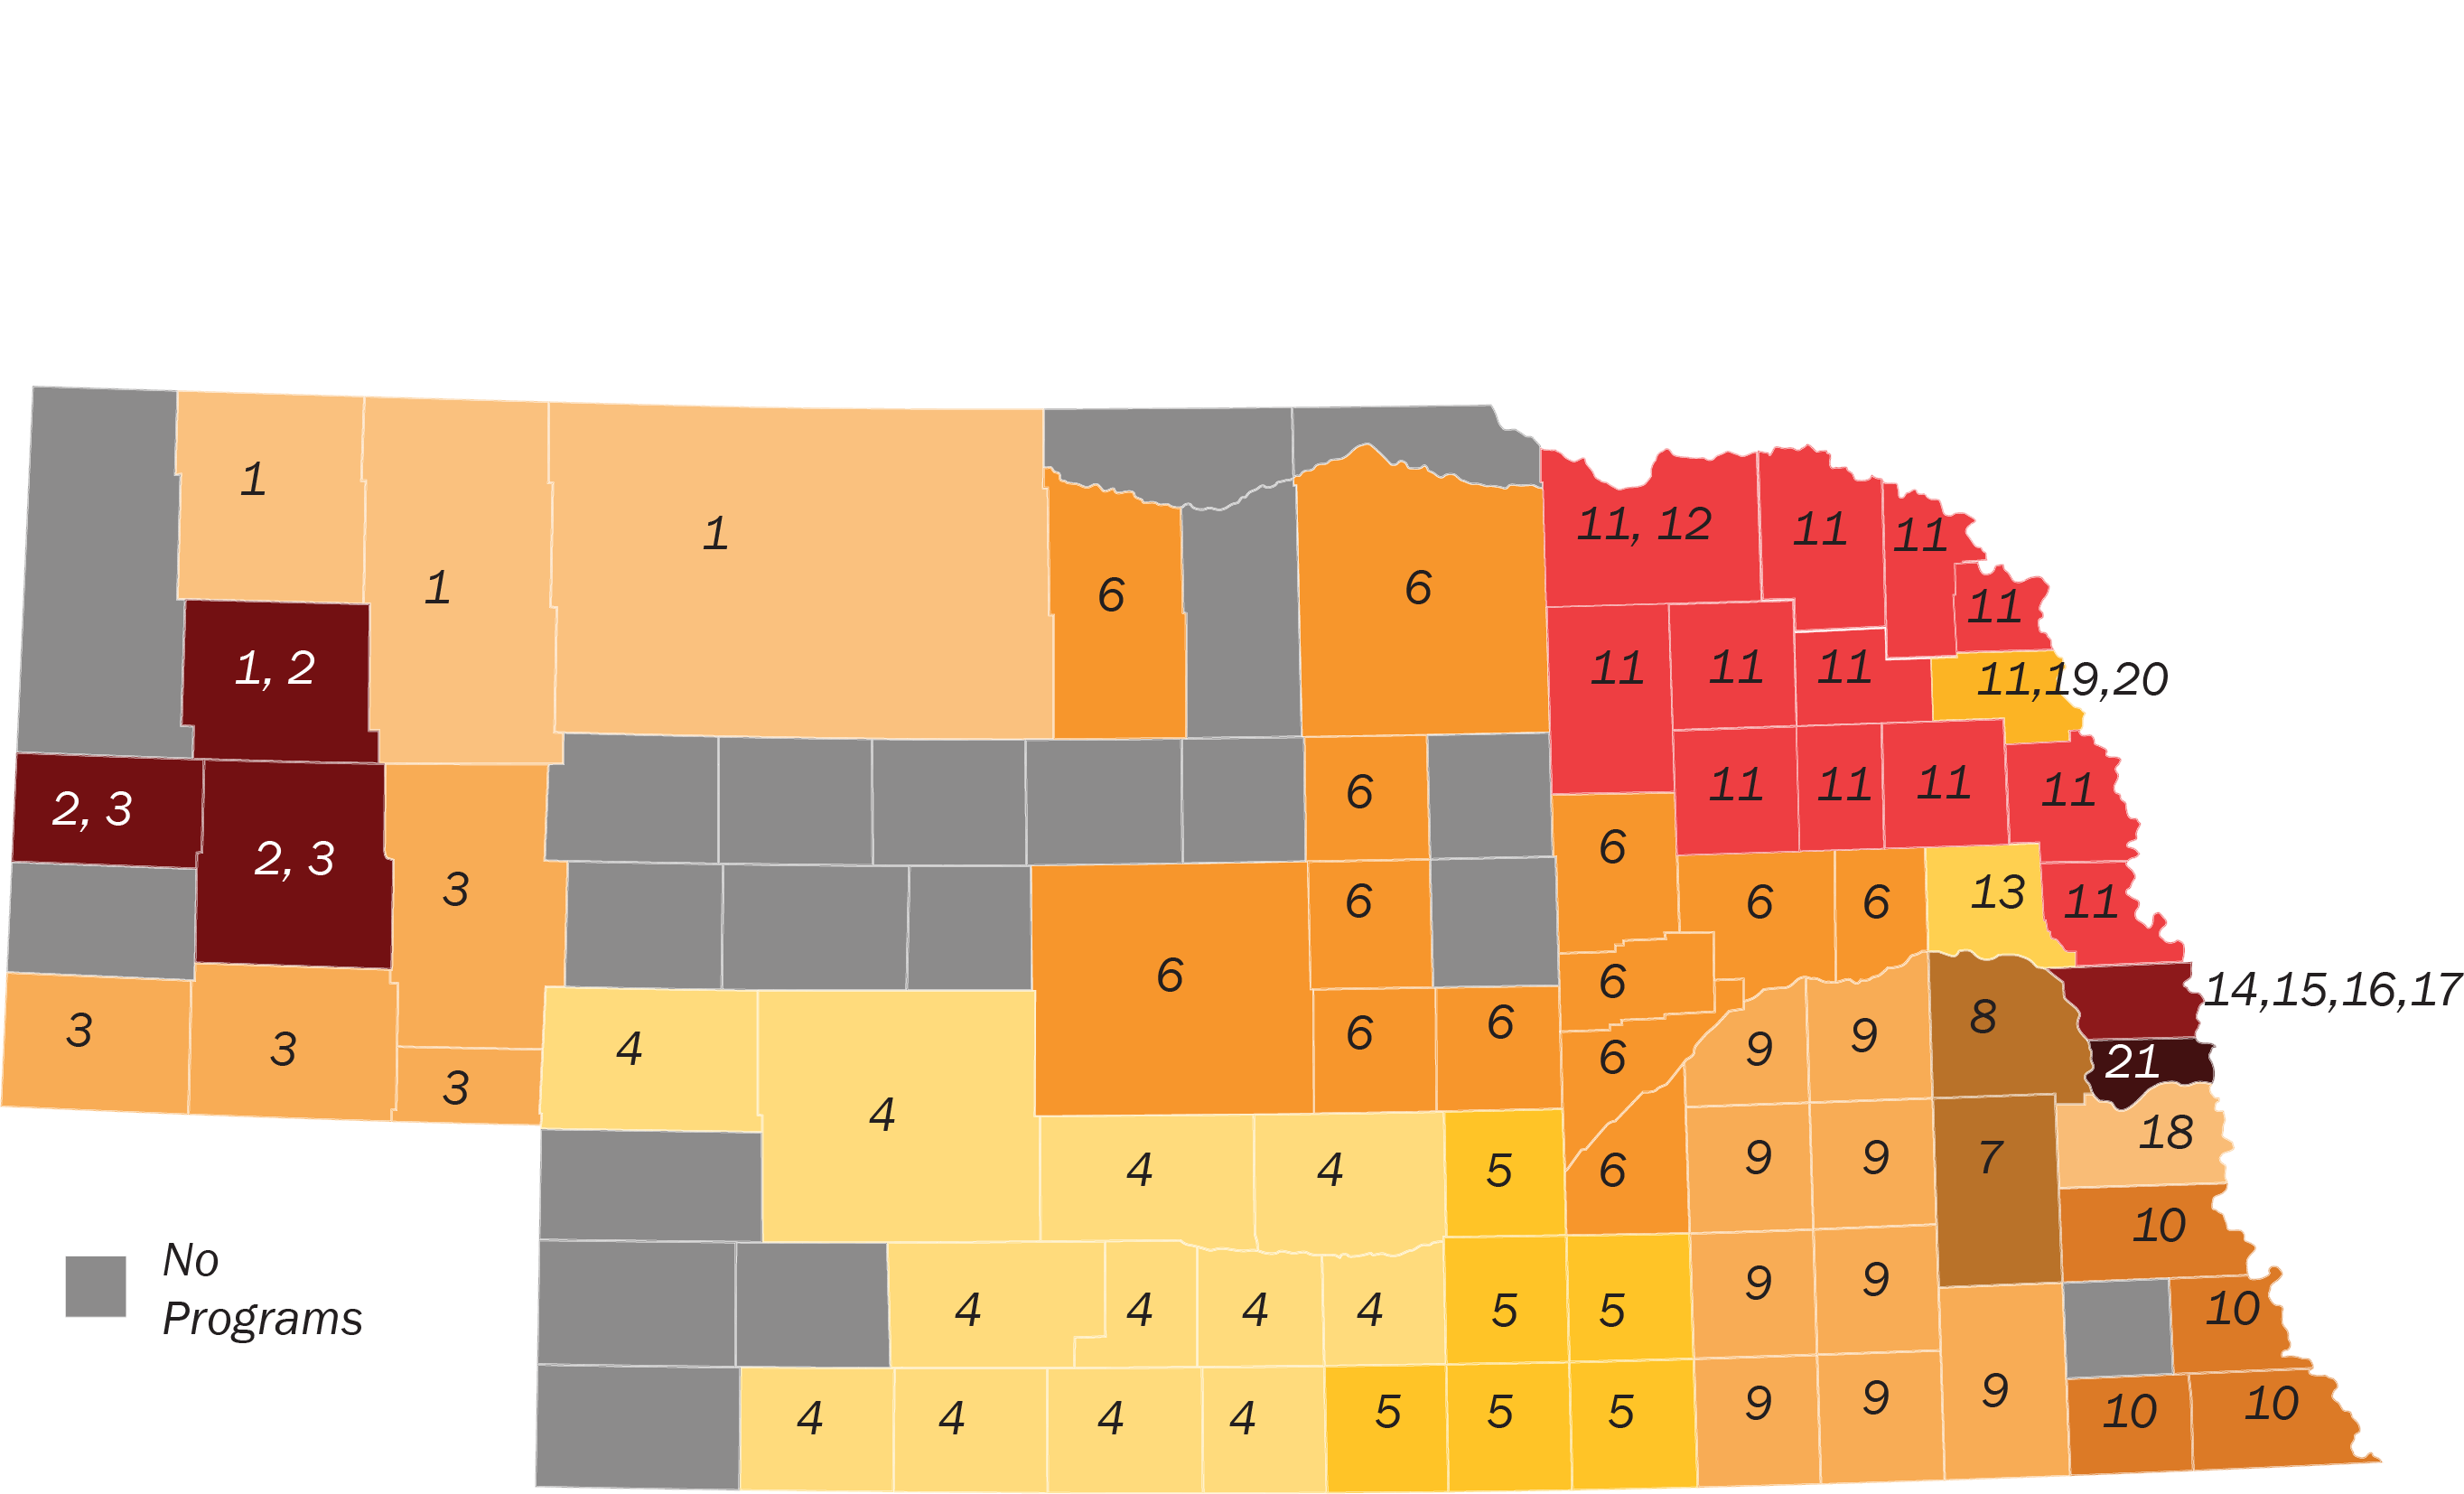
There were 16 Head Start and 14 Early Head Start Grantees – including two Delegate programs, four Tribal programs, and one Migrant and Seasonal program.
| # | Grantee Name | Total Served |
| 1 | Northwest Community Action Partnership | 258 |
| 2 | Migrant and Seasonal Head Start Grantee | 65 |
| 3 | Educational Service Unit 13 | 350 |
| 4 | Community Action Partnership of Mid-Nebraska | 386 |
| 5 | Head Start Child & Family Development Program, Inc. | 496 |
| 6 | Central Nebraska Community Services, Inc. | 552 |
| 7 | Community Action Partnership of Lancaster and Saunders Grantee | 600 |
| 8 | Wahoo Public Schools Head Start Delegate | 44 |
| 9 | Blue Valley Community Action Partnership | 329 |
| 10 | Southeast Nebraska Community Action | 156 |
| 11 | Northeast Nebraska Community Action Partnership | 417 |
| 12 | Santee Sioux Council Tribal Head Start | 35 |
| 13 | Midland University/Dodge County Early Head Start & Head Start | 94 |
| 14 | Salvation Army Early Head Start | 111 |
| 15 | Omaha Public Schools Head Start | 1,013 |
| 16 | Educare Omaha Early Head Start Delegate | 120 |
| 17 | Nebraska Early Childhood Collaborative | 176 |
| 18 | Plattsmouth Community Schools Early Head Start/Head Start | 120 |
| 19 | Omaha Tribe of Nebraska | 101 |
| 20 | Winnebago Tribe of Nebraska | 166 |
| 21 | Sarpy County Cooperative Head Start | 221 |
Early Childhood Education
176
children served by Head Start/Early Head Start were living in foster care.
946
children served by Head Start/Early Head Start were determined to have a disability.
1,816
children served by Head Start/ Early Head Start have a primary language other than English.
School-based preschool (2015/16)
15,665
children enrolled in public school-based preschool
Early Head Start/Head Start participants by race/ethnicity (2016)
- American Indian or Alaska Native (7.5%)
- Asian or Pacific Islander (2.0%)
- Black/African American (12.7%)
- Multi-racial or non-White, Hispanic (15.0%)
- Other/Unspecified (4.6%)
- White, Hispanic (18.8%)
- White, non-Hispanic (39.0%)
- American Indian or Alaska Native (7.5%)
- Asian or Pacific Islander (2.0%)
- Black/African American (12.7%)
- Multi-racial or non-White, Hispanic (15.0%)
- Other/Unspecified (4.6%)
- White, Hispanic (18.8%)
- White, non-Hispanic (39.0%)
Public school pre-k enrollment (1999/2000 - 2015/16)
Early Development Network
The Early Development Network (EDN) serves families with children born with disabilities.
1,619
infants and toddlers had an Individualized Family Service Plan through EDN.
Source: Special Education Office, Nebraska Department of Education.
Sixpence (2015/16)
Sixpence serves children birth to age 3 who are at risk of failure in school and is funded through public and private dollars. There were 31 Sixpence programs in the state of Nebraska in the 2015/16 program year serving:
- 961 families
- 117 pregnant moms
- 1,107 children
Child Care
Children need a safe environment while their parents work. Ensuring that caregivers are licensed is an important first step toward keeping children safe. This data shows counties with and without adequate licensed child care capacity.
Capacity of licensed child care facilities per 100 children under six with all available parents working, by county*
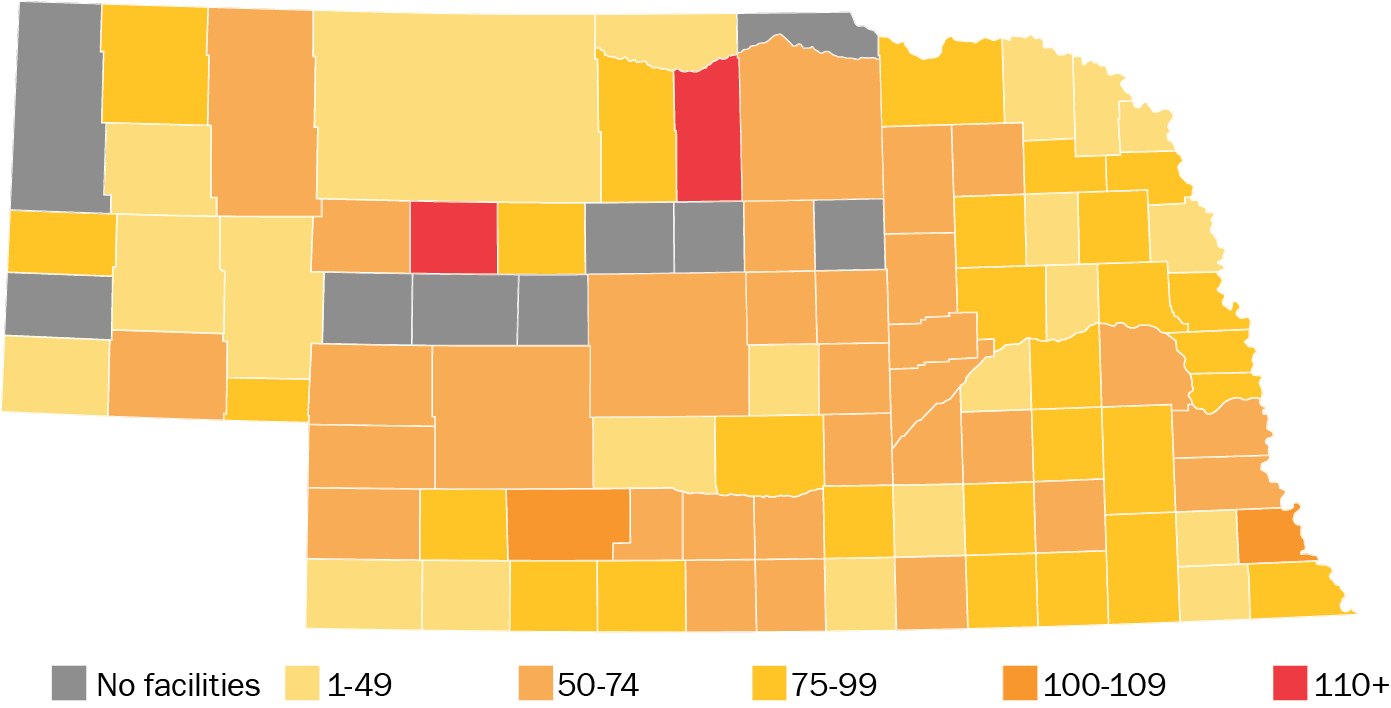
Licensed child care facilities (2017)
3,262 Total child care facilities
121,103 Total capacity
Annual child care costs (2017)
| Center-based care | |
| Infant | $9,157 |
| 4-year-old | $8,035 |
| Home-based care | |
| Infant | $7,194 |
| 4-year-old | $6,634 |
4,204
Nebraska parents quit, did not take, or greatly changed their job because of child care problems in 2016.
Source: 2016 National Survey of Children’s Health.
Child care subsidies (SFY 2016)
- There were 29,986 children in Nebraska who received child care subsidies in SFY 2016, for an average annual payment per child of $3,192. 2,862 children were in the care of a license-exempt facility.
- An average of 17,039 children received a subsidy each month, for an average monthly payment per child of $468.* 11,697 were below school-age, and 6,050 were school-age.
- 23,711 children receiving a subsidy were from a family living below 100% of the Federal Poverty Line (FPL), 8,798 were from families between 100%-130% FPL and 8,683 were TANF transition.
- $61,505,842 in state and $38,490,861 in federal funds spent were spent on the child care subsidy program.
QRIS
Nebraska Step Up to Quality is an Early Childhood Quality Rating and Improvement System (QRIS), passed by the Nebraska Legislature in 2013. The primary goal of Nebraska Step Up to Quality is to improve early care and education quality and increase positive outcomes for young children. This is done through informing parents about quality early care and education programs in understandable and measurable ways. In addition, it improves teacher and director effectiveness through training and professional development, formal education, and coaching. It also emphasizes strengthening the understanding and use of standards, assessment processes, and using data to improve quality.
As of 11/20/2017, Nebraska had
264 Step Up to Quality Programs
Nebraska Step Up to Quality program providers by step (11/20/2017)
131 Providers – Step 1: The program has completed the application to participate in Step Up to Quality, staff members have submitted a professional record, and the program’s director completes orientation.
87 Providers – Step 2: The program director completes several trainings related to safety, child health, and early learning and management as well as several self assessments related to child development knowledge.
46 Providers – Steps 3-5: Programs that are at Step 2 can begin earning points to reach Step 3 or higher. Points are earned through additional training and professional development, environment, quality of instruction and curriculum, measurable child outcomes, family and community partnership engagement, and program management.
Nebraska Step Up to Quality programs by county (as of 11/20/2017)
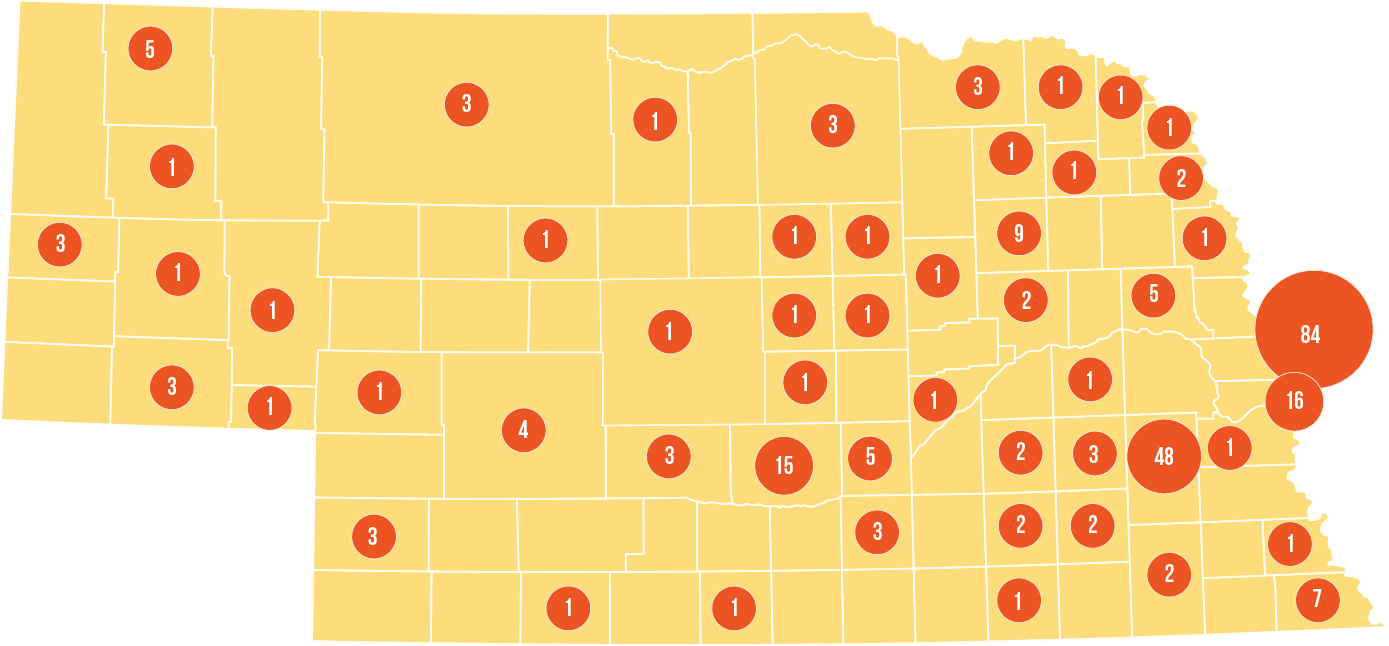
299,877 children were enrolled in public school in 2015/16.
School membership by grade (2015/16)
Student Characteristics
140,275 public and nonpublic students were eligible for free and reduced meals in 2015/16.
| MEAL PROGRAM PARTICIPATION | |
| Breakfast | Lunch |
| 266 districts 945 sites |
379 districts 1,142 sites |
| COMMUNITY ELIGIBILITY (2015/16)* | ||
| Schools | Children | |
| Eligible | 104 | 39,503 |
| Served | 14 | 3,031 |
*The Community Eligibility Provision allows high poverty schools to serve school meals at no cost to all enrolled students without collecting household applications. The number of children eligible for the Community Eligibility Program is based on proxy data.
Percentage of public and nonpublic students eligible for free and reduced school meals (2005/06 - 2015/16)
There were 263 Summer Food Participation sites in 2016 each serving an average of 64 meals daily.
14.7% of students were classified as Special Education (2015/16).
14.0% of students were classified as High Ability Learners (2015/16).
Public school cost per pupil in 2016 dollars (2005/06 - 2015/16)
4.5%
of Nebraska school students were highly mobile, meaning they enrolled in two or more public schools during the 2015/16 school year.
Rate of home schooled students per 1,000 students (2005/06 - 2015/16)
Percentage of students who were English language learners (2005/06 - 2015/16)
Test Scores - Reading
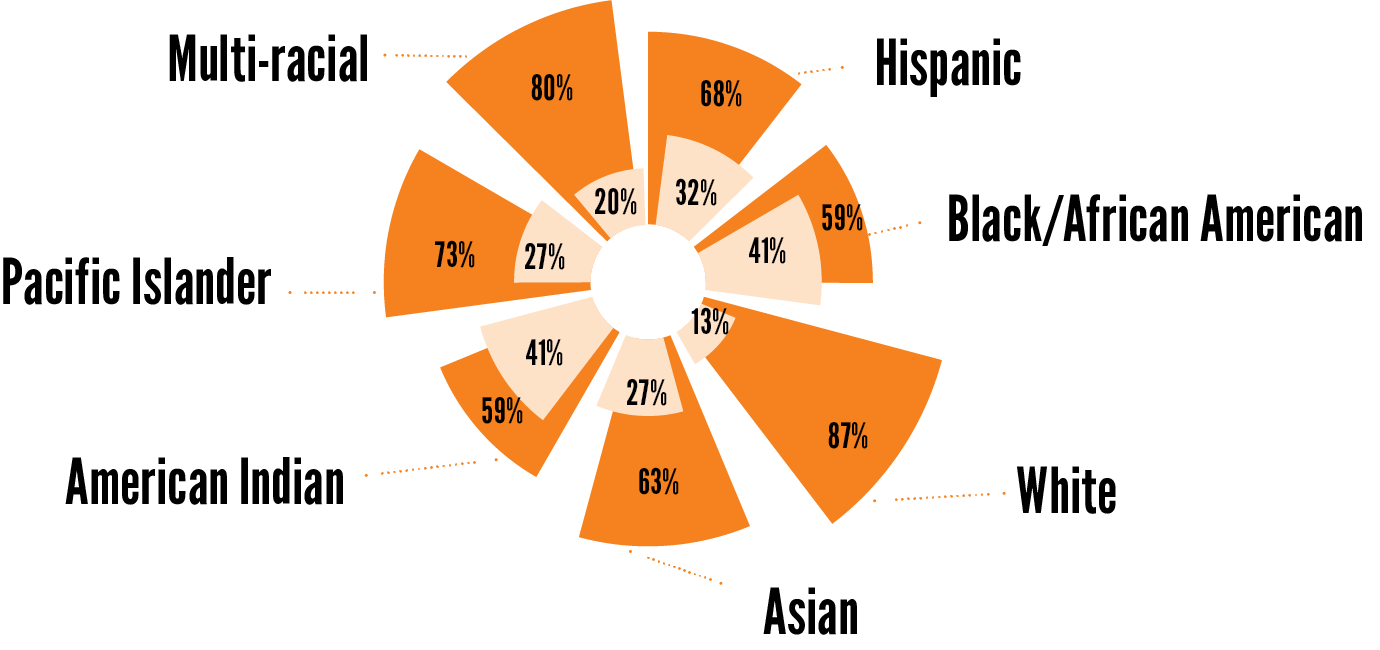
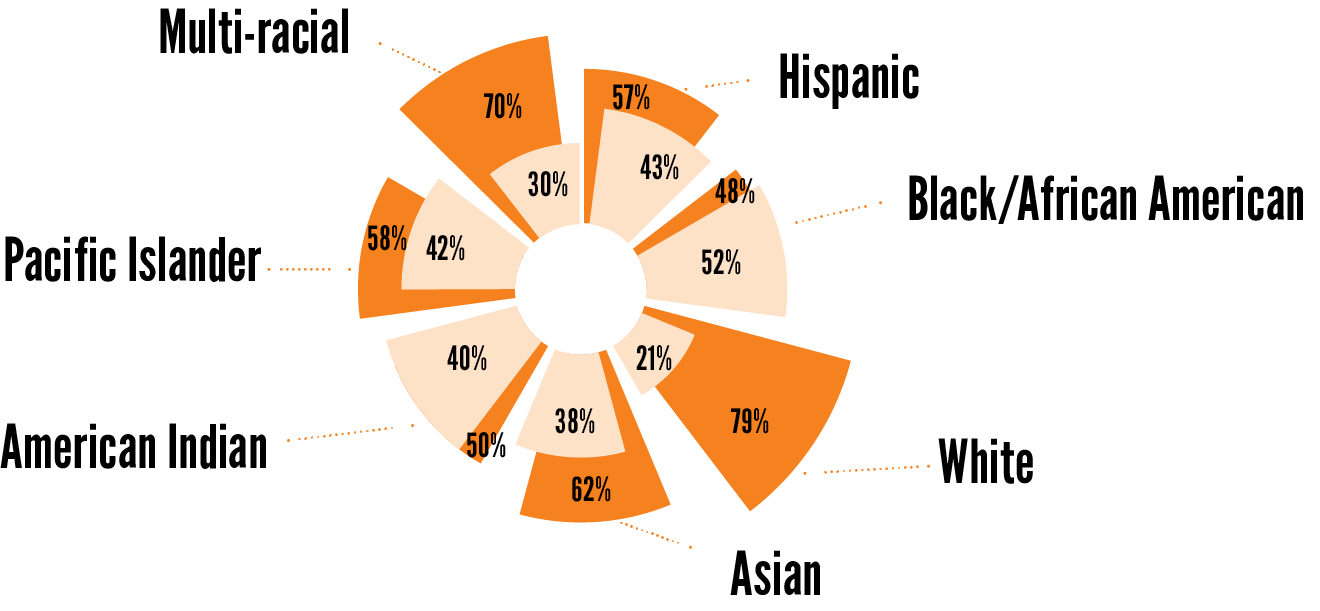
Reading is a fundamental skill that affects learning experiences and school performance of children and teens. The ability to read proficiently translates to a greater likelihood of performing well in other subjects. Children with lower reading achievement are less likely to be engaged in the classroom, graduate high school, and attend college.
3rd Grade (2015/16)
84%
of children overall read proficiently
76%
of low-income children read proficiently
8th Grade (2015/16)
81%
of children overall read proficiently
69%
of low-income children read proficiently
11th Grade (2015/16)
72%
of children overall read proficiently
57%
of low-income children read proficiently
Test Scores - Math
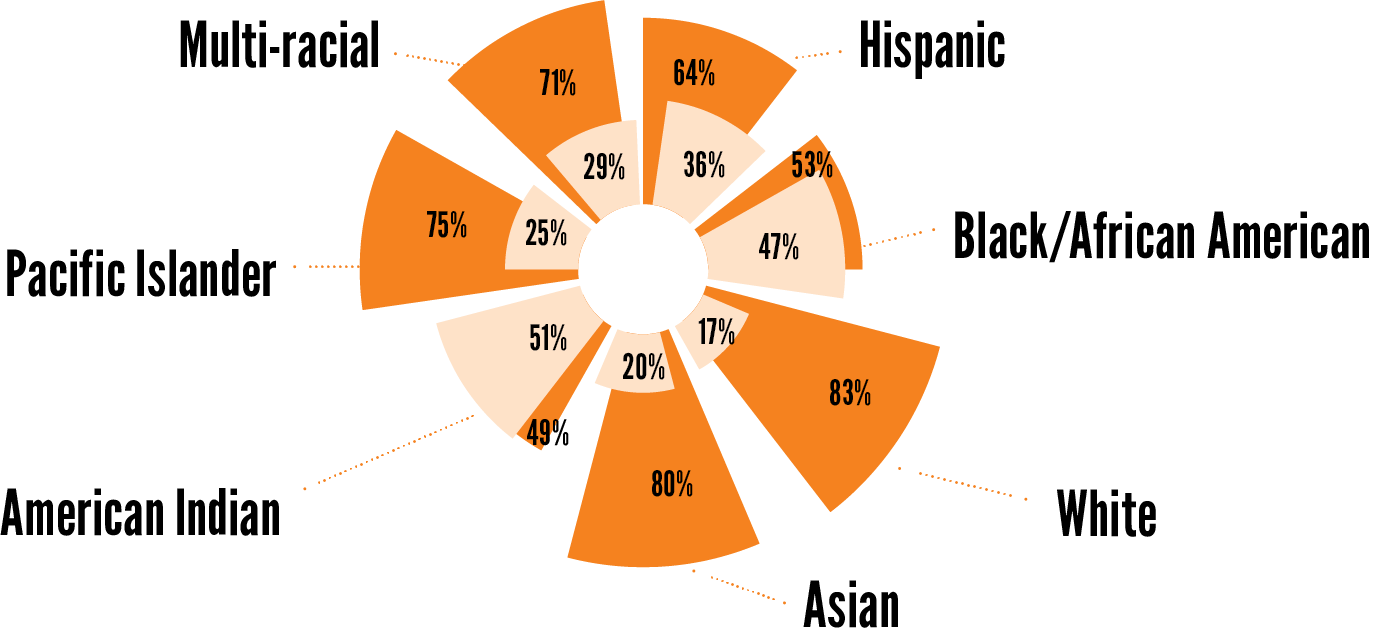
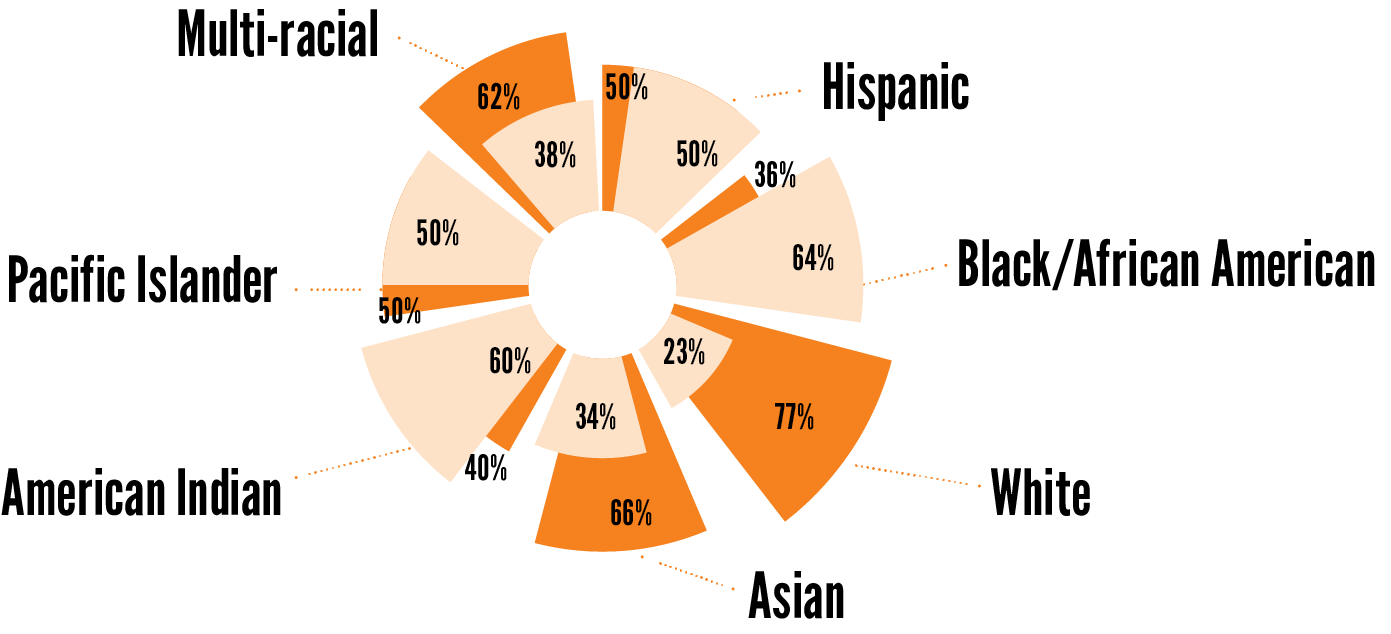
Math skills are essential for functioning in everyday life, as well as for future success in our increasingly technical work environment. Students who take higher courses in mathematics are more likely to attend and complete college. Those with limited math skills are more likely to find it difficult to function in everyday society and have lower levels of employability.
5th Grade (2015/16)
77%
of children overall are proficient in math
65%
of low-income children are proficient in math
8th Grade (2015/16)
68%
of children overall are proficient in math
51%
of low-income children are proficient in math
11th Grade (2015/16)
62%
of children overall are proficient in math
42%
of low-income children are proficient in math
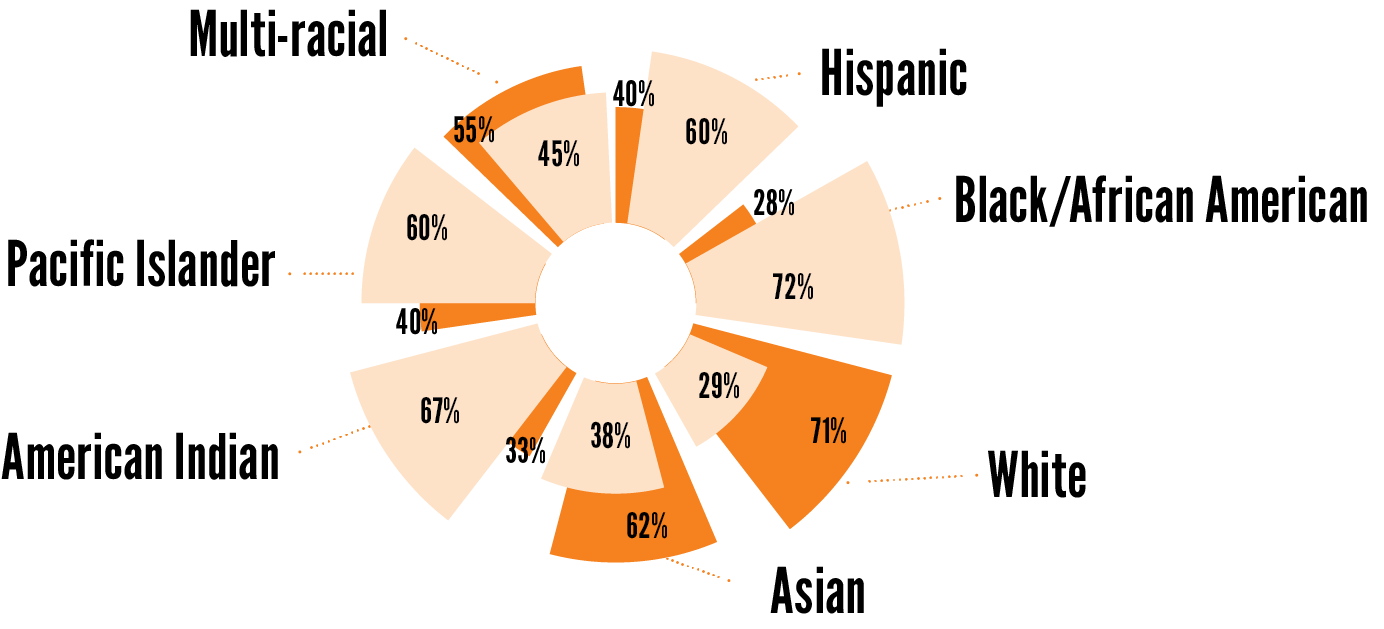
Test Scores - Science
Proficiency in science helps prepare students to go on to highly skilled professions. Having a strong foundation in the sciences allows students to work in today’s high demand fields. Students with a greater understanding of sciences learn how to better protect the environment and increase the health and security of people throughout the world.
5th Grade (2015/16)
74%
of children overall are proficient in science
60%
of low-income children are proficient in science
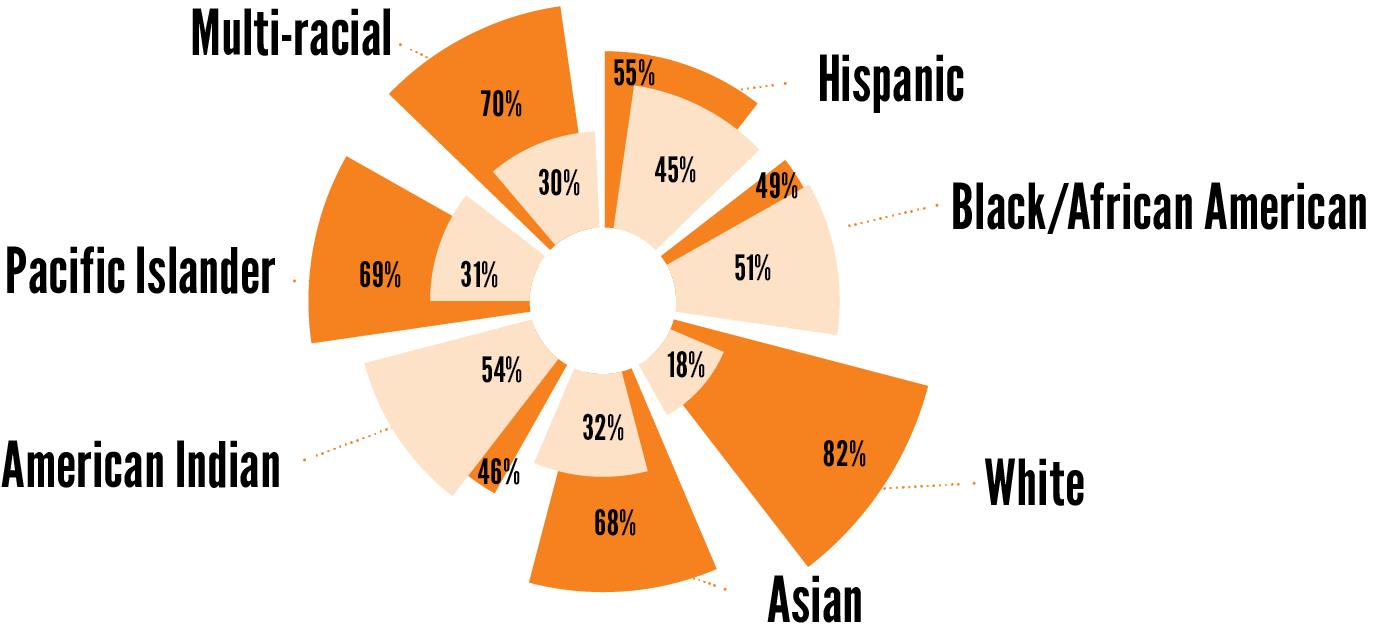
8th Grade (2015/16)
68%
of children overall are proficient in science
52%
of low-income children are proficient in science
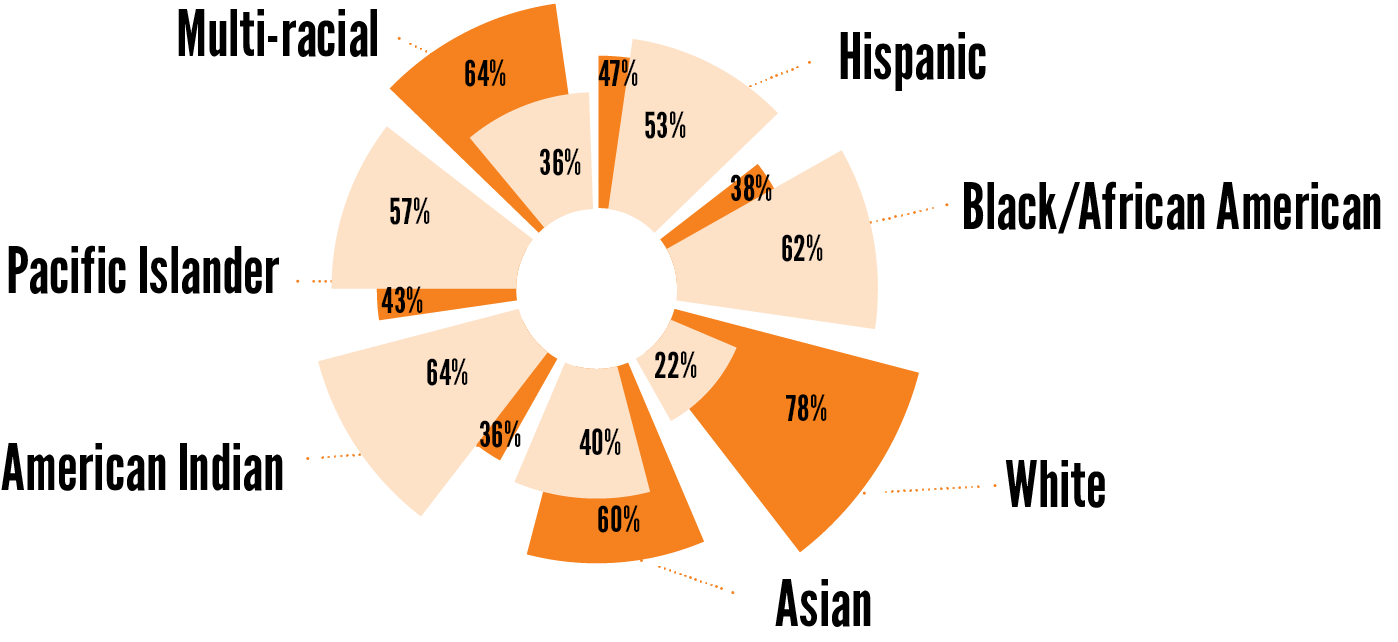
11th Grade (2015/16)
74%
of children overall are proficient in science
57%
of low-income children are proficient in science
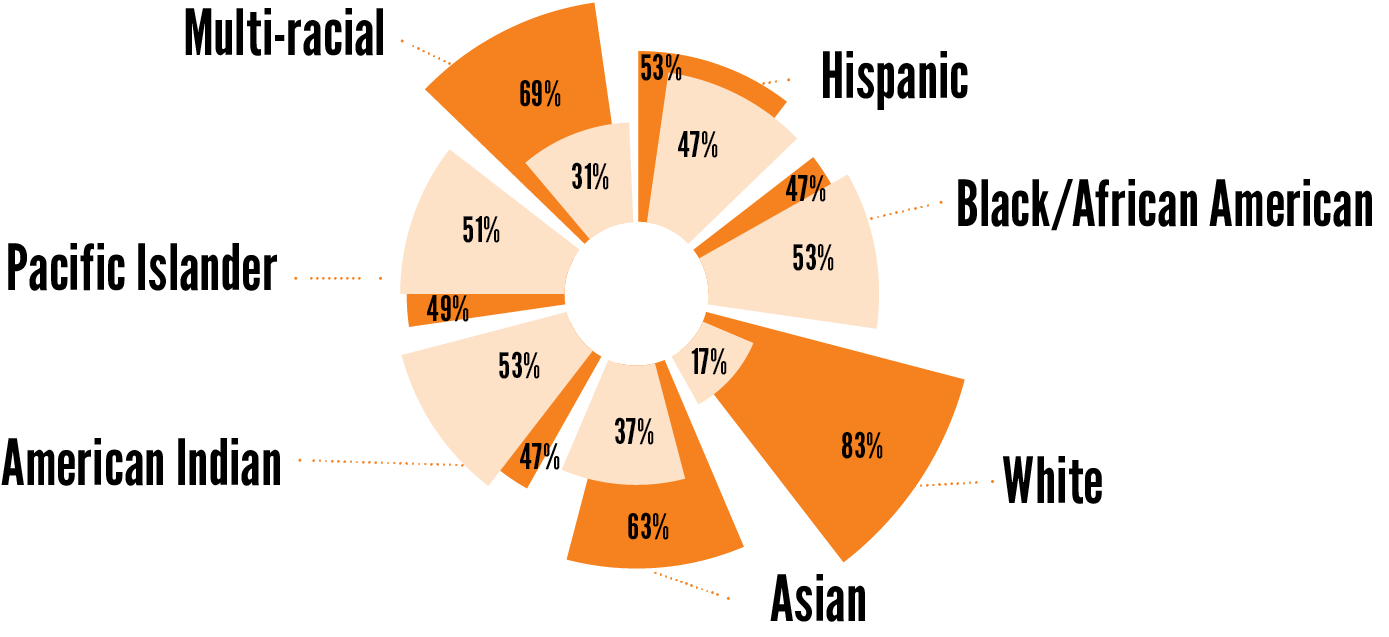
Absences
Children need to be in school to achieve educational success and all the positive life outcomes that go with it. Too often, children are pushed out of the school system through suspensions, expulsions, and referrals to the court system. The cumulative sum of these practices, often referred to as “the school to prison pipeline,” has been shown to have a negative impact on students, schools, and academic achievement. When a student is suspended, they become less likely to graduate on time and more likely to repeat a grade, drop out without earning a diploma, and become involved with the juvenile justice system. Studies have also shown that schools with a higher reliance on school exclusion as a form of discipline actually score lower on academic achievement tests, even when controlling for socioeconomic and demographic factors. Policies that keep kids in the classroom produce better results for students, schools, and our communities as a whole.
728 (0.2%) students in public and nonpublic schools were EXPELLED during the 2015/16 school year.
13,521 (4.0%) students in public and nonpublic schools were SUSPENDED during the 2015/16 school year.
1,737 public and nonpublic students dropped out in 2015/16.
Public school absences (2015/16)
59,254
(18.8%) students were absent
10-19 days
12,927
(4.1%) students were absent
20-29 days
10,093
(3.2%) students were absent
30+ days
Graduation & Career
71% of Nebraska’s 2015/16 public high school graduates had enrolled in college by April 2017.1
66% of 2010 Nebraska high school graduates who enrolled in a 4-year public college completed within six years.2
40% of 2010 Nebraska high school graduates who enrolled in a 2-year public college completed within six years.2
16,296 students took the ACT during the 2015/16 school year with average composite score of 21.0 (20.8 nationally).3
18,000 (9%) of young adults age 18-24 were not attending school, not working, and had no degree beyond high school.4
96,000 (50%) of young adults age 18-24 were enrolled in or completed college.4
6,000 (6%) of teens 16-19 were not in school and not working.4
15,107 students were enrolled in a career academy or dual credit courses in 2015/16.1
4. Annie E. Casey Foundation, Kids Count Data Center.
19,668
students completed high school in four years in 2015/16.
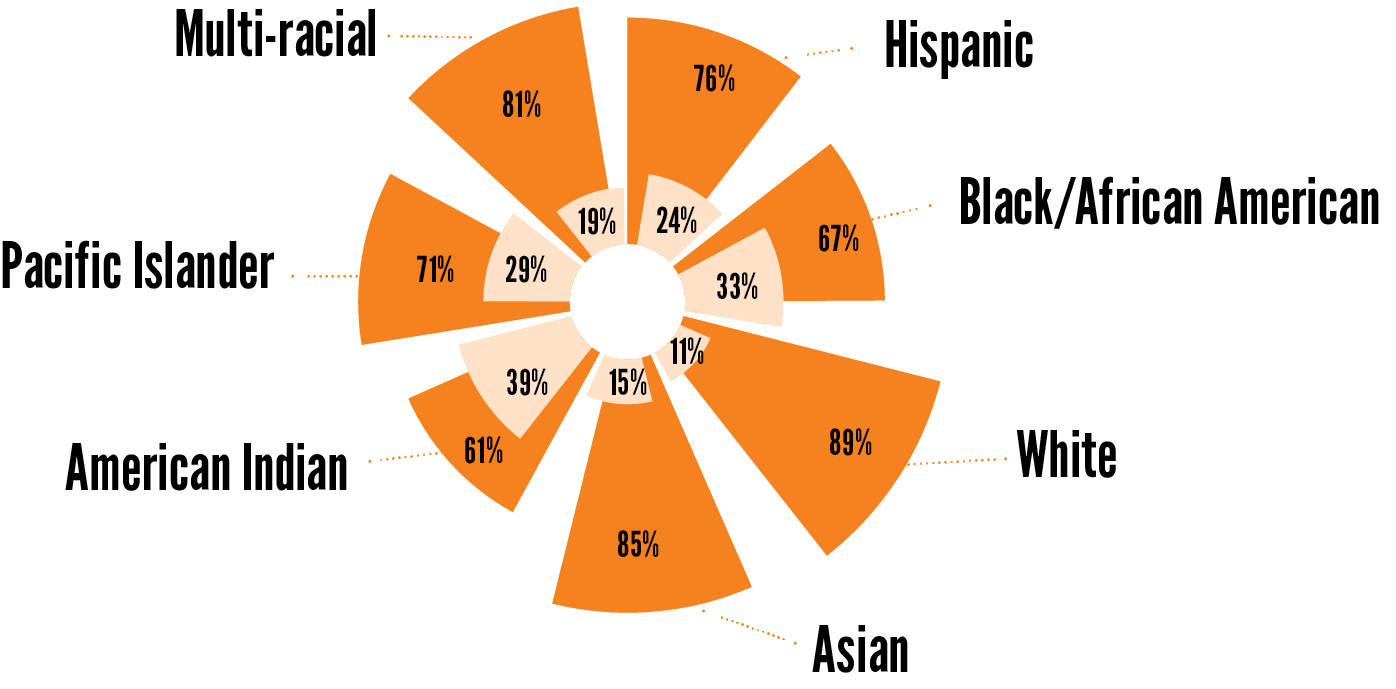
2016 cohort four-year graduation rates by student demographics
91.6%
2016 extended 5-year graduation rate,*
an increase from 88.9% from the 2015 cohort 4-year graduation rate.
Source: Nebraska Department of Education.

