Why does it matter?
Keeping our children and youth safe is essential to their healthy development. Responding to the troubling behaviors of children and youth in developmentally appropriate ways while promoting community safety is key to ensuring every child can build a successful, independent adult life.
67% of youth cases in juvenile court had access to legal counsel in 2016.
310 youth cases were prosecuted in adult court in 2016,
an 84% decrease from 1,972 youth in 2013.
Arrests
Youth arrests (2016)
| Type | Male | Female | Total | % of Total |
| Status Offenses | 672 | 482 | 1,154 | 12.2% |
| Runaway | 160 | 131 | 291 | 3.1% |
| Curfew | 92 | 52 | 144 | 1.5% |
| Alcohol | 420 | 299 | 719 | 7.6% |
| Drug Related | 948 | 397 | 1,345 | 14.2% |
| Violent | 172 | 14 | 186 | 2.0% |
| Person | 997 | 516 | 1,513 | 16.0% |
| Property | 2,091 | 1,176 | 3,267 | 34.5% |
| Public Order | 271 | 164 | 435 | 4.6% |
| Weapons | 87 | 7 | 94 | 1.0% |
| Other | 937 | 416 | 1,353 | 14.3% |
| DUI | 81 | 33 | 114 | 1.2% |
| Total | 6,256 | 3,205 | 9,461 |
Offense types
“Status offenses” are non-criminal behaviors, like skipping school, that could not be charged but for the “status” of being a minor.
Violent offenses include: criminal homicide, forcible rape, robbery, and aggravated assault.
Person offenses include: offense against family and children, simple assault, sex offenses, and prostitution.
Property offenses include: burglary, larceny, motor vehicle theft, arson, forgery, fraud, embezzlement, stolen property, and vandalism.
Public order offenses include: disorderly conduct, and vagrancy.
9,461 youth were arrested in 2016,
a 41% decrease from 16,063 arrests in 2007.
Number of youth arrested (2007-2016)
Youth arrests by race (2016)
- American Indian, 208 (2.2%)
- Asian, 68 (0.7%)
- Black, 2,087 (22.1%)
- Unknown, 63 (0.6%)
- White, 7,035 (74.4%)
- American Indian, 208 (2.2%)
- Asian, 68 (0.7%)
- Black, 2,087 (22.1%)
- Unknown, 63 (0.6%)
- White, 7,035 (74.4%)
Disproportionate Minority Contact
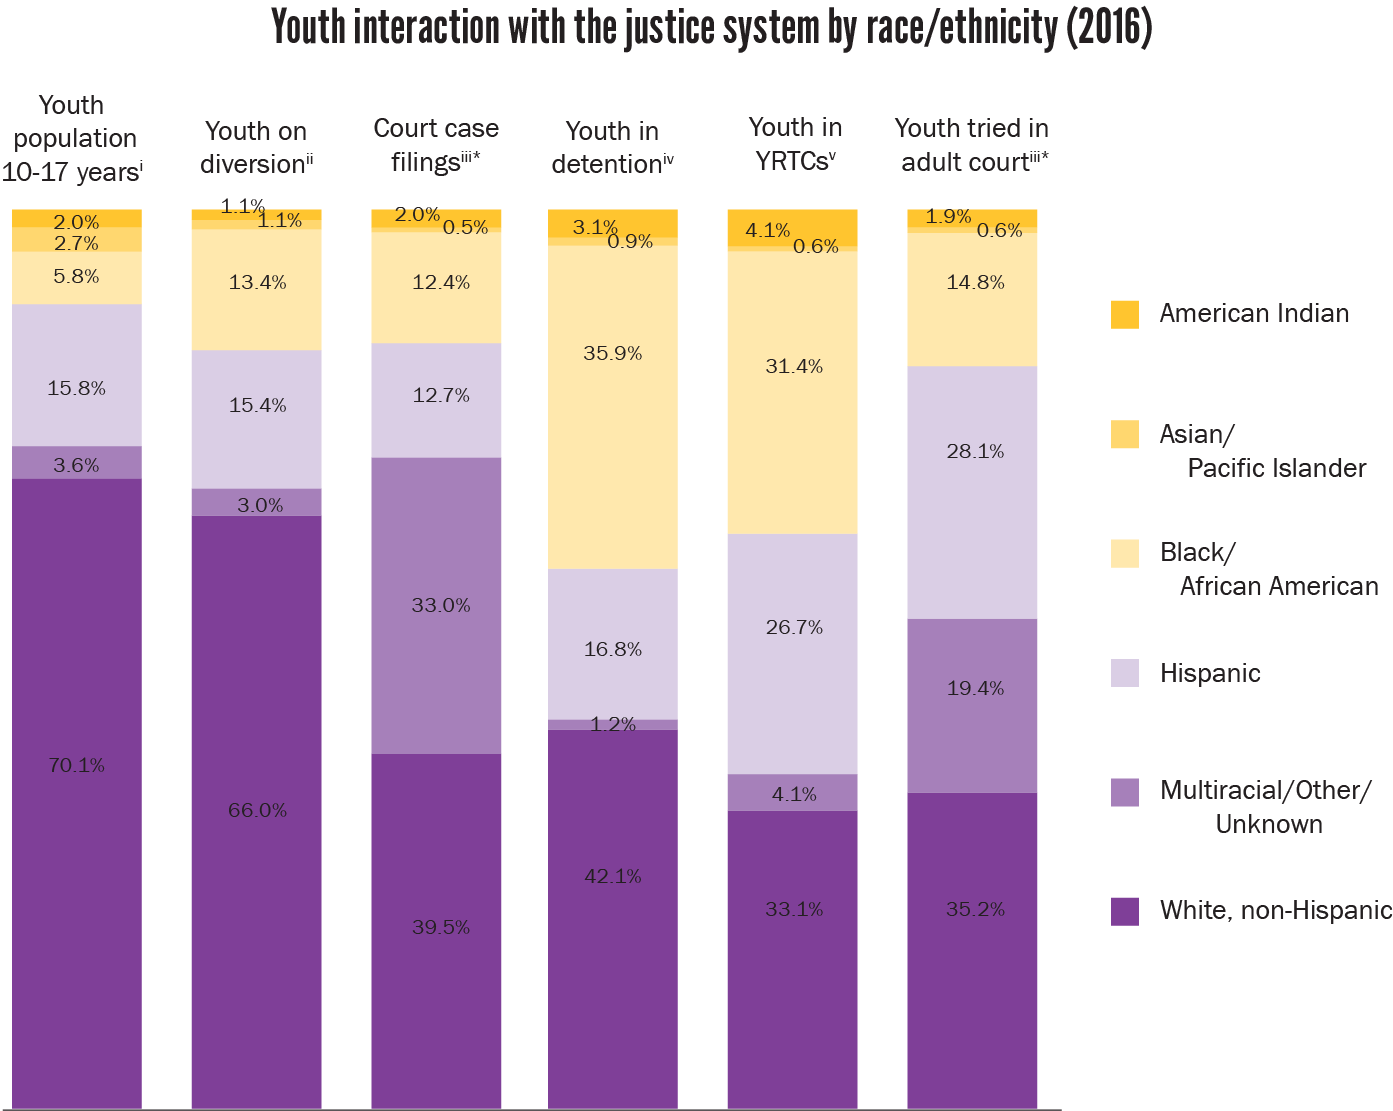
Disproportionate minority contact (DMC)
Despite the promise of equal protection under the law, national research shows that youth of color are overrepresented in the juvenile justice system. This overrepresentation often is a product of decisions made at early points of contact with the juvenile justice system. Where racial differences are found to exist, they tend to accumulate as youth are processed deeper into the system.1
Unfortunately, our juvenile justice system lacks uniform ways of collecting data on race and ethnicity. Although disparities exist across system points, different agencies have different ways of counting Hispanic youth in particular. Additional information on the race and ethnicity of youth arrested, on probation, and in adult prison are available elsewhere in this section.
ii. Nebraska Commission on Law Enforcement and Criminal Justice.
iii. JUSTICE, Administrative Office of the Courts.
iv. Analysis based on data from individual facilities including Lancaster County Detention Center, Northeast Nebraska Juvenile Services, Douglas County Youth Center, and the Patrick J. Thomas Juvenile Justice Center.
v. SFY 2015/16 Annual Reports for Kearney and Geneva Youth Rehabilitation and Treatment Centers.
*Data is input by clerks across the state and may not be well standardized. This may account for the large “multiracial/other/unknown” category.
Pre-Trial Diversion
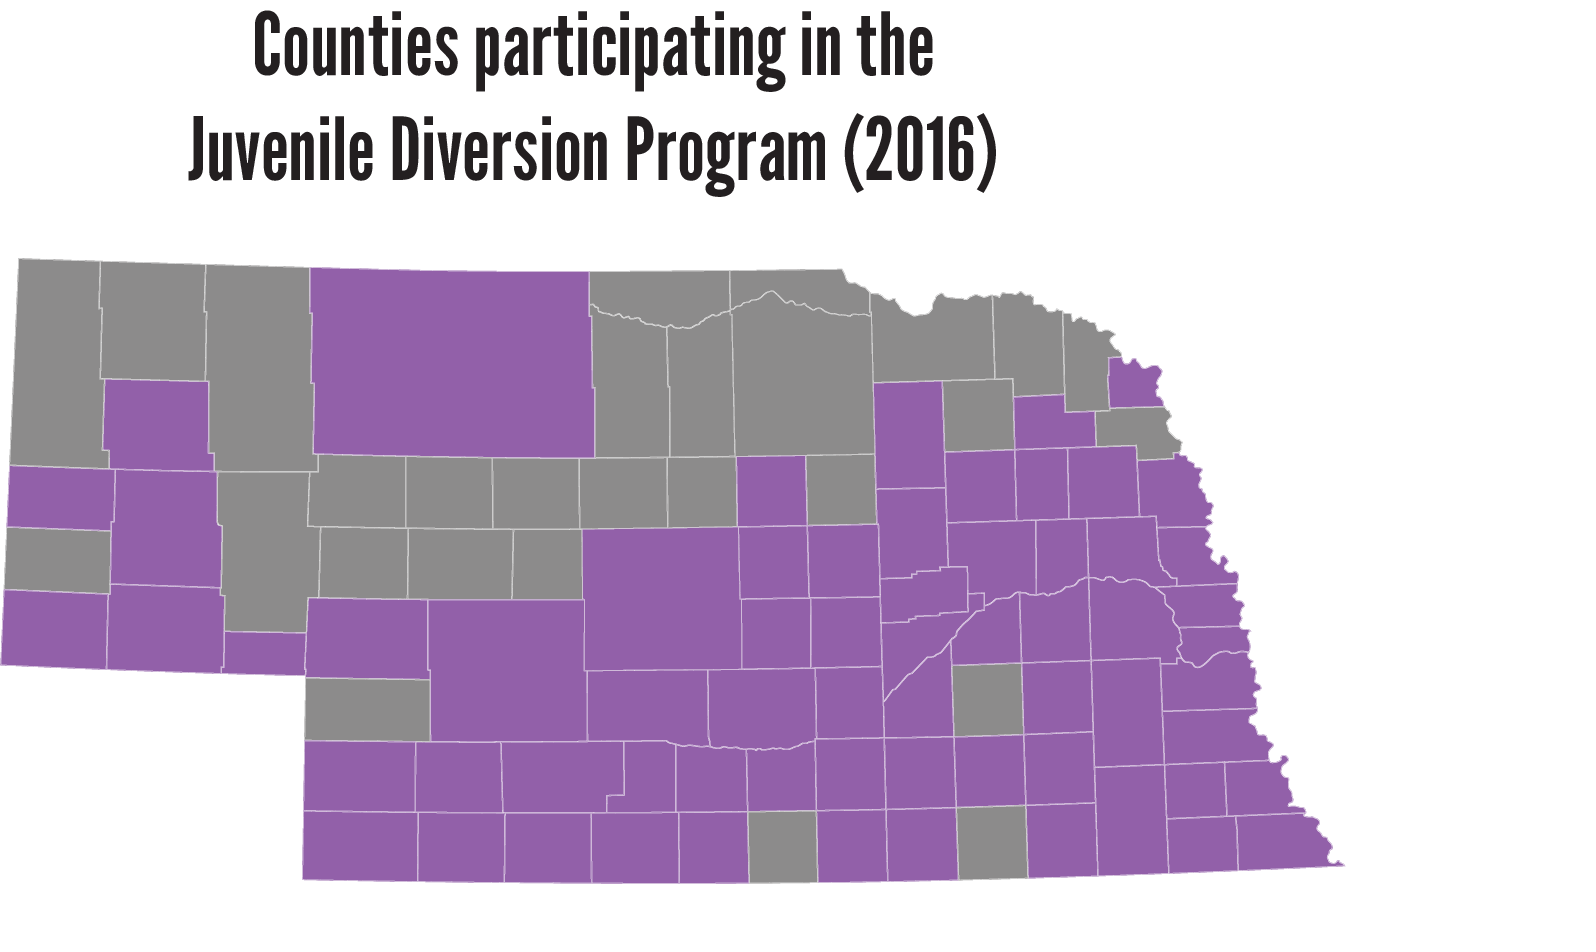
Juvenile diversion program
Pretrial diversion programs are based on the belief that many juvenile cases are better handled outside the courthouse doors. These voluntary programs are designed to provide eligible youth an opportunity to demonstrate rehabilitation and make things right with the community, while reducing the cost and burden to taxpayers and courts that come with formal charges being filed. By successfully completing his or her diversion plan, a minor has the opportunity to avoid formal charges in the court and get all record of the matter sealed. By diverting these cases from the court system, counties save significant dollars, making successful diversion programs a win-win.
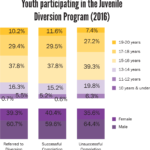
3,952
youth were referred to the diversion program.
519
of those referred did not participate.
2,657
youth successfully completed diversion.
489
youth did not complete diversion successfully and were discharged for failing to comply or for a new law violation.
65
counties participated in the diversion program.
511
youth did not complete diversion successfully and were discharged for failing to comply or for a new law violation.
Community-Based Juvenile Services Aid Program
Community-Based Juvenile Services Aid Program (2015)
In 2016, 248 programs in 67 counties and 2 tribes were funded through the Community-Based Juvenile Services Aid Program with a total funding of $6,300,000.
| Funded programs: | |
| Direct intervention | 175 |
| Prevention/promotion event | 7 |
| Direct service | 21 |
| System improvement | 45 |
Juvenile Cases
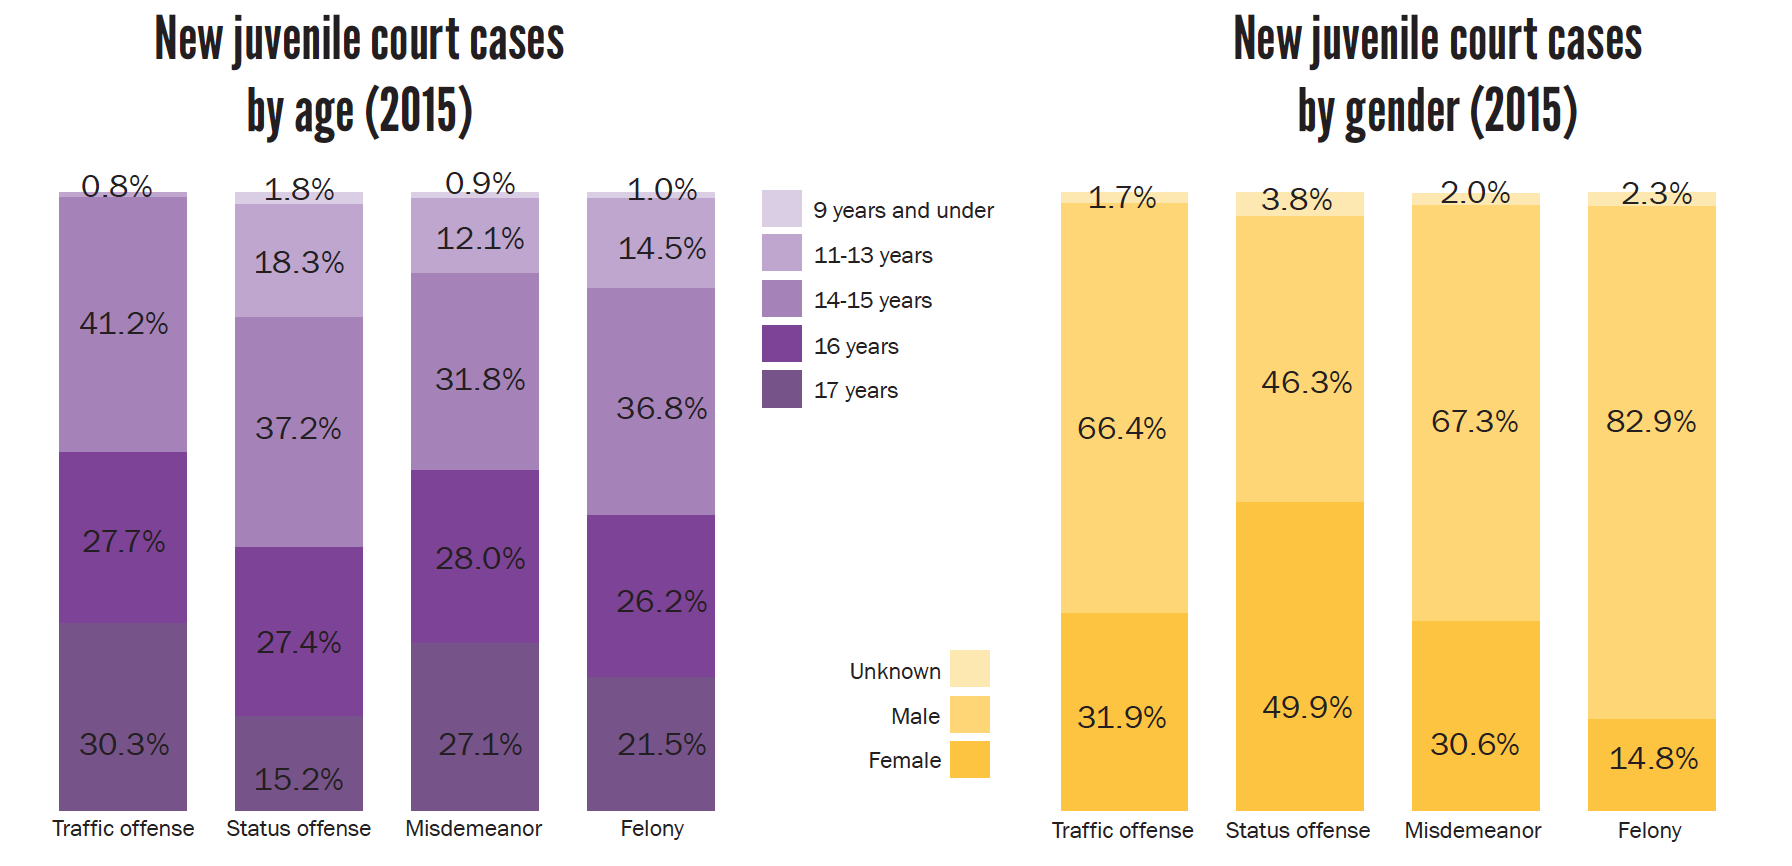
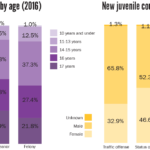
New juvenile courts cases by race/ethnicity (2016)
| Traffic offense | Status offense | Misdemeanor | Felony | |||||
| American Indian | 0 | 0% | 14 | 1.7% | 75 | 2.2% | 8 | 1.6% |
| Asian or Pacific Islander | 1 | 0.7% | 4 | 0.5% | 12 | 0.4% | 7 | 1.4% |
| Black/African American | 3 | 2.0% | 43 | 5.1% | 468 | 14.0% | 83 | 16.7% |
| Hispanic | 48 | 31.6% | 79 | 9.4% | 441 | 13.2% | 45 | 9.1% |
| Other | 0 | 0% | 3 | 0.4% | 21 | 0.6% | 1 | 0.2% |
| Unknown | 11 | 7.2% | 450 | 53.5% | 968 | 29.0% | 139 | 28.0% |
| White | 89 | 58.6% | 248 | 29.5% | 1.357 | 40.6% | 213 | 42.9% |
| Total Cases | 152 | 68% of cases were adjudicated as “admit” | 841 | 62% of cases were adjudicated as “admit” | 3,342 | 65% of cases were adjudicated as “admit” | 496 | 63% of cases were adjudicated as “admit” |
303 days
is the average length of time from filing to case termination.
287 days
is the average length of time from filing to case termination for status offense cases.
376 days
is the average length of time from filing to case termination for delinquency cases.
Access to Counsel
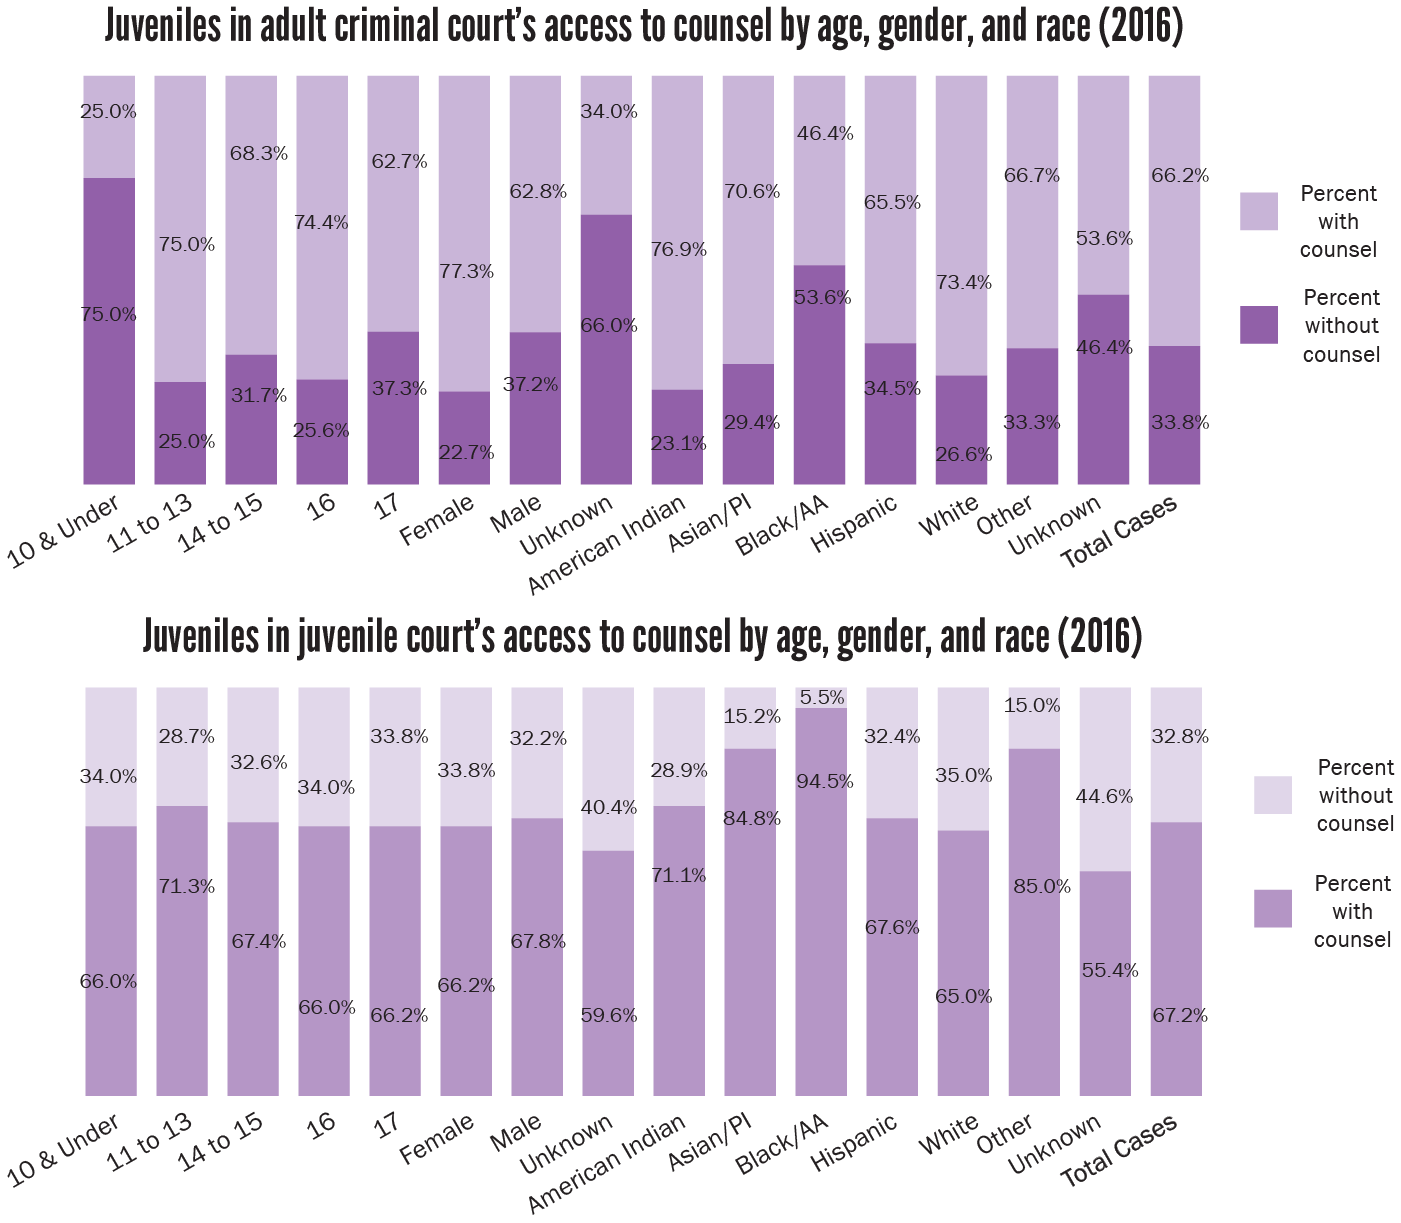
Juvenile access to counsel
Having an attorney present during proceedings in the juvenile justice system is not only important for youth, but a guaranteed constitutional right. The right to counsel is also enshrined in Nebraska statute 43-272(1). The law is meant to protect children at every stage of legal proceedings, and requires the court to advise youth, along with their parents, of their right to an attorney and that legal counsel can be provided at no cost if they are unable to afford it. Unfortunately, all too frequently youth are not accessing this important protection.
33.8%
of children in adult criminal court had an attorney in 2016.
67.2%
of children in juvenile court had an attorney in 2016.
Probation
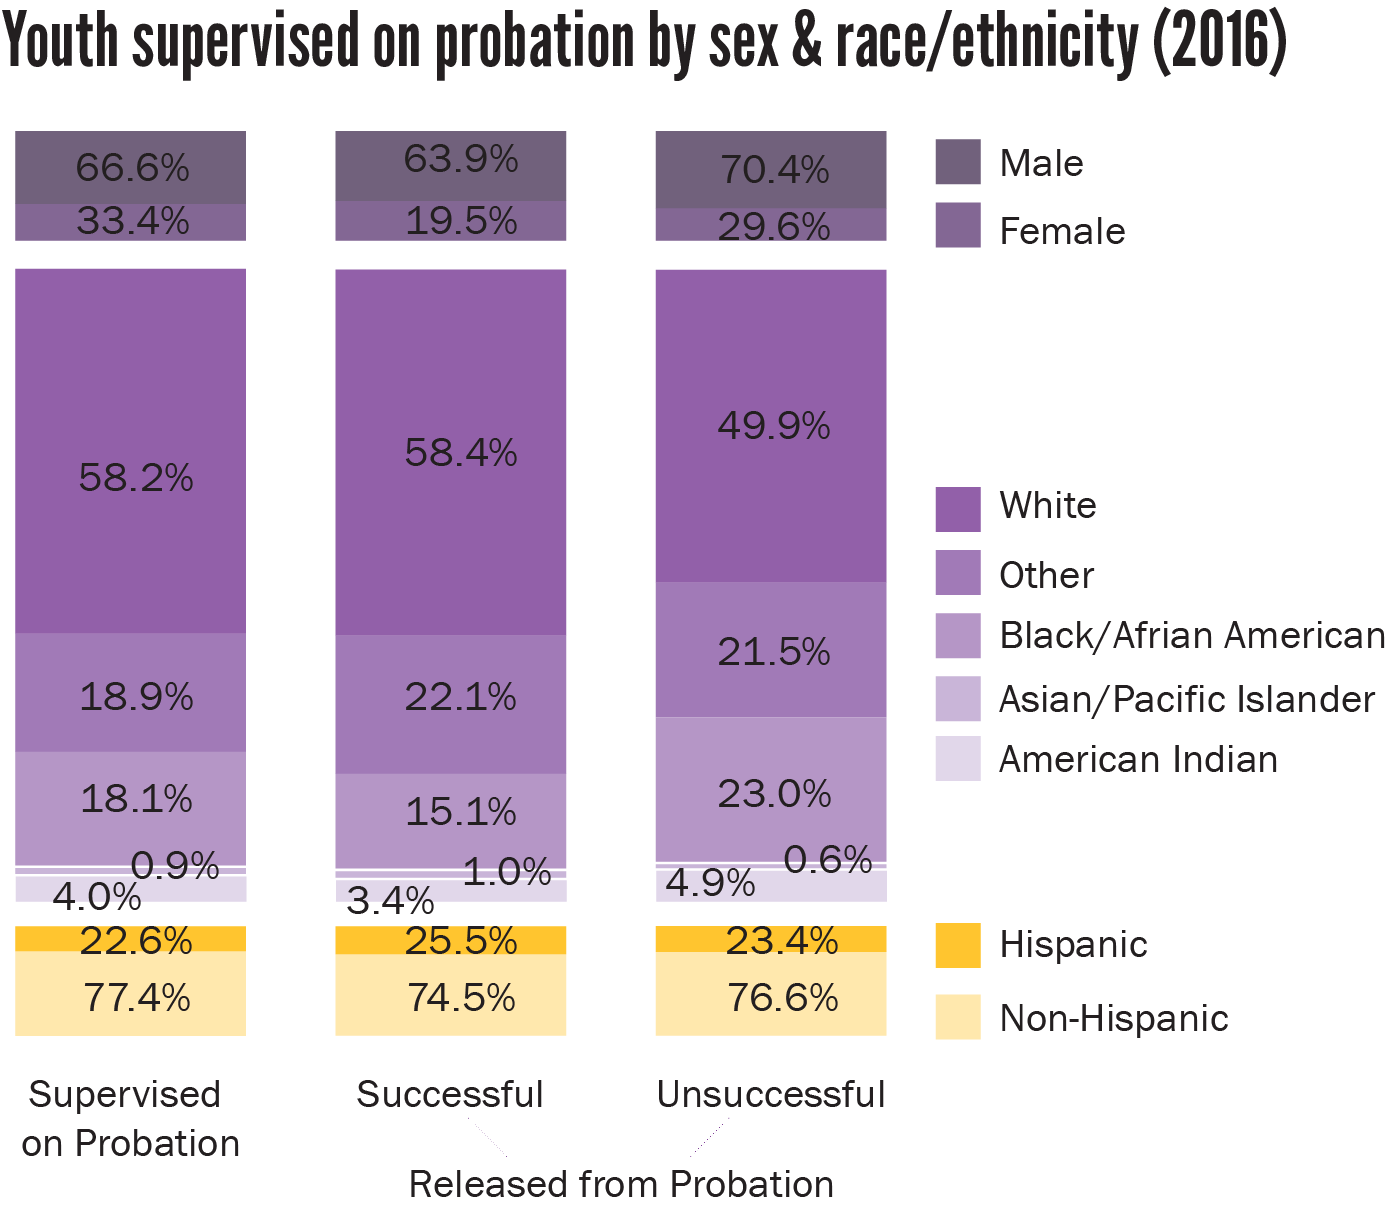
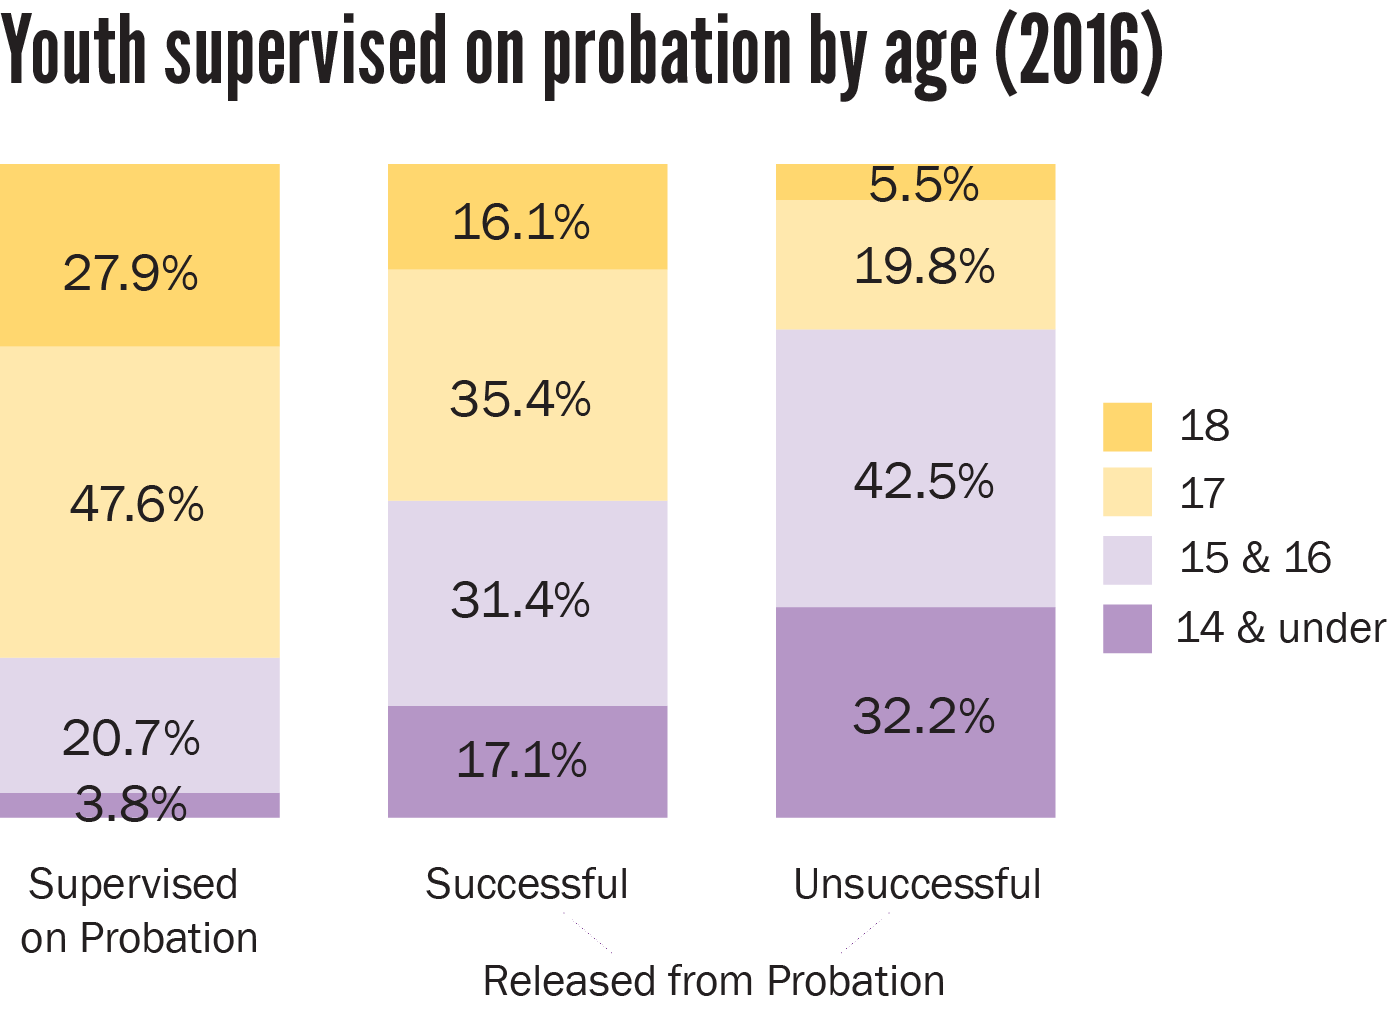
In 2016, 5,482 youths were supervised on probation –
• 796 had felony offenses
• 4,163 had misdemeanor, infraction, traffic, or city ordinance offenses
• 1,674 had status offenses
• 2,877 youths were placed on probation in 2016
• 3,215 were discharged
2,195 youths supervised on probation had an out-of-home placement. Placements include non-treatment and treatment congregate care, foster care, detention, runaway, YRTC, and jail.
$3,706
is the average total cost per juvenile receiving in-home services.
$17.36
is the average daily cost for supervising a juvenile on probation.
$22,055
is the average total cost per juvenile receiving out-of-home services.
13 months
is the mean length of time on probation in 2016.
13 months
is the mean length of time in out-of-home care in 2016.
Detention
Youths ages 17 & under held in juvenile detention facilities* (2016)
| Lancaster County Detention Center (Lancaster County) | North East Nebraska Juvenile Services (Madison County) | Douglas County Youth Center(Douglas County) | Patrick J. Thomas Juvenile Justice Center (Sarpy County) | |||||||
| Number | Percent | Number | Percent | Number | Percent | Number | Percent | |||
| Gender | ||||||||||
| Female | 132 | 33.1% | 117 | 26.9% | 348 | 29.1% | 41 | 30.8% | ||
| Male | 267 | 66.9% | 318 | 73.1% | 846 | 70.9% | 92 | 69.2% | ||
| Race/ethnicity | ||||||||||
| American Indian/Alaska Native | 14 | 3.5% | 24 | 5.5% | 30 | 2.5% | 2 | 1.5% | ||
| Asian/Pacific Islander | 8 | 2.0% | 0 | 0.0% | 11 | 0.9% | 1 | 0.8% | ||
| Black/African American | 118 | 29.6% | 45 | 10.3% | 610 | 51.1% | 17 | 12.8% | ||
| Hispanic | 56 | 14.0% | 105 | 24.1% | 184 | 15.4% | 18 | 13.5% | ||
| Other | 5 | 1.3% | 0 | 0.0% | 8 | 0.7% | 1 | 0.8% | ||
| White | 198 | 49.6% | 251 | 57.7% | 351 | 29.4% | 94 | 70.7% | ||
| Age | ||||||||||
| 12 & under | 3 | 0.8% | 9 | 2.1% | 29 | 2.4% | 0 | 0.0% | ||
| 13-14 | 58 | 14.5% | 75 | 17.2% | 203 | 17.0% | 12 | 9.0% | ||
| 15-16 | 183 | 45.9% | 222 | 51.0% | 492 | 41.2% | 57 | 42.9% | ||
| 17+ | 202 | 50.6% | 39 | 32.0% | 396 | 33.2% | 64 | 48.1% | ||
| Times detained*** | ||||||||||
| 1 | 27 | 17.4% | 396 | 91.0% | Not Available | 96 | 70.6% | |||
| 2 | 76 | 49.0% | 24 | 5.5% | 18 | 13.2% | ||||
| 3+ | 52 | 32.9% | 15 | 3.4% | 19 | 14.0% | ||||
| Total count | 399 | 435 | 1,194 | 133 | ||||||
| Secure**** | 415 | 232 | 1,026 | n/a | ||||||
| Staff Secure**** | 40 | 144 | 168 | 133 | ||||||
| Average Days Detained | 3.33 in staff secure. 19.8 in secure. | 19 days | 36.8 days | 17.3 days |
*Includes secure and staff secure detention.
***Douglas County Youth Center’s data systems are unable to provide data on times detained for 2016.
**** Youth may go back and forth between secure and staff secure several times during the year. As a result these two values may sum much higher than the total number of youth detained at each facility.
Youth Rehabilitation and Treatment Centers
| Geneva | Kearney | |
| Number admitted for treatment | 40 | 132 |
| Average daily population | 33 | 97 |
| Average length of stay | 8.7 months | 9.4 months |
| Average age at admission | 16 | 16 |
| Average per diem cost, per youth | $598.75 | $348.55 |
| Recidivism Rate | 9.8% | 23% |
| Race /ethnicity breakdown | American Indian: 10.0%
Asian: 3.0% Black, non-Hispanic: 25.0% Hispanic: 22.0% Other: 15.0% White, non-Hispanic: 25.0% |
American Indian: 2.0%
Asian: 0.0% Black, non-Hispanic: 33.0% Hispanic: 28.0% Other: 1.0% White, non-Hispanic: 36.0% |
| Releases | 51 girls released Parole: 0.0% Probation: 94.0% Court Safekeeper: 0.0% Institutional Discharge: 6.0% |
139 boys released Parole: 0.0% Probation: 89.0% Court Safekeeper: 1.0% Institutional Discharge: 11.0% |
Type of offenses in Geneva’s YRTC
- Status Offense (5.0%)
- Weapon (0%)
- Probation (0.0%)
- Public Order (32.5%)
- Drug (2.5%)
- Property (22.5%)
- Person (37.5%)
- Status Offense (5.0%)
- Weapon (0%)
- Probation (0.0%)
- Public Order (32.5%)
- Drug (2.5%)
- Property (22.5%)
- Person (37.5%)
Type of offenses in Kearney’s YRTC
- Status Offense (0.0%)
- Weapon (9.1%)
- Probation (0.8%)
- Public Order (28.5%)
- Drug (9.8%)
- Property (28.5%)
- Person (27.3%)
- Status Offense (0.0%)
- Weapon (9.1%)
- Probation (0.8%)
- Public Order (28.5%)
- Drug (9.8%)
- Property (28.5%)
- Person (27.3%)
YRTC admissions (2007-2016)
- Kearney
- Geneva
- Kearney
- Geneva
Office of Juvenile Services (OJS) Wards
OJS Wards
Most state wards are committed to DHHS custody through child welfare proceedings, typically on allegations of parental neglect or abuse, with the exception of wards under OJS supervision. Under current law, youth who are committed to one of Nebraska’s two YRTCs for law violations are made wards of the state under OJS. There are also a handful of youth still in OJS custody but not placed at YRTC, who were grandfathered in from before the law changed.
338
OJS wards
OJS wards by race/ethnicity (2016)
OJS wards by age (2016)
| Placements of OJS wards (2016)* | ||
| Group home | 3 | 0.6% |
| Independent living | 7 | 1.3% |
| Runaway | 26 | 4.8% |
| Foster home | 4 | 0.7% |
| Medical/treatment facility | 38 | 7.0% |
| Detention | 146 | 26.8% |
| YRTC | 306 | 56.3% |
| Emergency shelter | 2 | 0.4% |
| Kinship/relative care | 8 | 1.5% |
| Parents | 4 | 0.7% |
| Services to OJS wards (2016)** | ||
| Medical | 2 | 1.4% |
| Basic needs (housing, food, clothing, stipend, interpreter) | 79 | 54.1% |
| Mental/behavioral health | 9 | 6.2% |
| Group home | 10 | 6.9% |
| Out-of-home Care | 37 | 25.3% |
| Family | 9 | 6.2% |
Source: Nebraska Department of Health and Human Services.
Youth Treated as Adults
In 2016, 310 youth cases were prosecuted in Nebraska adult courts, down from 1,972 in 2013.
Of the 310 youth cases, 27% were traffic cases, 45% were misdemeanor cases, and 29% were felony cases.
Youth in adult prisons and jails
64 youth (18 and under) were incarcerated by the Nebraska Department of Correctional Services in 2016.
- 60 males
- 4 females
An age-appropriate response
Research consistently indicates that treating children as adults neither acts as a deterrent, nor does it prevent crime or reduce violence – instead, prosecution in adult court exposes youth to more risks, delays or prevents treatment, and can burden them with permanent records which may act as barriers to future education and employment opportunities. In 2014, the Nebraska Legislature passed LB 464, a bill intended to bring children back from criminal prosecution and into the developmentally-appropriate juvenile court. Beginning in 2015, Nebraska law now requires that all children age 17 or younger charged with a misdemeanor or lowlevel felony must have their cases originate in juvenile court. This means that many more children are now receiving the benefit of speedy access to treatment services, a developmentally-appropriate court process aimed at rehabilitation, and the potential to have their records sealed to set them up for a brighter future.
Youth cases tried in adult court (2016)
| Youth cases prosecuted in adult court | Sentenced to probation | Sentenced to jail | Sentenced to prison | |||||
| Male | 219 | 70.6% | 156 | 69.3% | 56 | 72.7% | 25 | 83.3% |
| Female | 75 | 24.2% | 62 | 27.7% | 13 | 16.9% | 2 | 6.7% |
| Unknown | 16 | 5.2% | 6 | 2.7% | 8 | 8% | 3 | 10.0% |
| 14 to 15 | 41 | 13.2% | 35 | 15.6% | 0 | 0.0% | 6 | 20.0% |
| 16 | 77 | 24.8% | 68 | 30.4% | 7 | 9.1% | 4 | 13.3% |
| 17 | 192 | 61.9% | 121 | 54.0% | 70 | 90.9% | 20 | 66.7% |
| Total* | 310 | 224 | 77 | 30 | ||||
| American Indian | 6 | 1.9% | 1 | 0.4% | 5 | 6.5% | 0 | 0.0% |
| Asian | 2 | 0.6% | 2 | 0.9% | 0 | 0.0% | 0 | 0.0% |
| Black/African American | 46 | 14.8% | 23 | 10.3% | 9 | 11.7% | 14 | 46.7% |
| Hispanic | 87 | 28.1% | 67 | 29.9% | 18 | 23.4% | 5 | 16.7% |
| Unknown/other | 60 | 19.4% | 46 | 20.5% | 19 | 24.7% | 5 | 16.7% |
| White | 109 | 35.2% | 85 | 37.9% | 26 | 33.8% | 6 | 20.0% |
Source: JUSTICE, Administrative Office of the Courts.
Youth incarcerated in correctional facilities by race/ethnicity (2016)
- American Indian, 5 (7.9%)
- Asian/Pacific Islander, 1 (1.6%)
- Black/African American, 30 (47.6%)
- Hispanic, 11 (17.5%)
- Other/Unknown, 1 (1.6%)
- White, 15 (23.8%)
- American Indian, 5 (7.9%)
- Asian/Pacific Islander, 1 (1.6%)
- Black/African American, 30 (47.6%)
- Hispanic, 11 (17.5%)
- Other/Unknown, 1 (1.6%)
- White, 15 (23.8%)
Source: Nebraska Department of Correctional Services.

