Our children, communities, and state are stronger when all of Nebraska’s families are able to participate fully in the workforce and establish financial security. We must ensure that families are able to meet their children’s basic needs and save for the future. A robust system of supports should help families make ends meet as they work toward financial independence. Hardworking families should have a fair share in the success of our state’s economy. When families need assistance in meeting the basic needs of their children, public benefit programs should work efficiently and effectively to provide a safety net for temporary challenges. Parents should not have to choose between the job they need and the family they love. All families should have the opportunity to invest in their children’s future and be able to access community resources that are well-funded by fair tax policies.
Poverty
Nebraska poverty (2009-2019)1
- Percent of Children in Poverty
- Percent of Families in Poverty
- Percent of All Persons in Poverty
- Percent of Children in Poverty
- Percent of Families in Poverty
- Percent of All Persons in Poverty
34.3%
of children living in single-mother households are in poverty.1
13.7%
of children living in single-father households are in poverty.3
3.8%
of children living in married-couple households are in poverty.3
26.7%
of children living with a grandparent without a parent present are in poverty (2018).4
21,827 of which were in extreme poverty (<50% of the Federal Poverty Line).5

2. U.S. Census, 2019 American Community Survey 1-year estimate, Table B17006.
3. U.S. Census, 2018 American Community Survey 5-year estimate, Table S1001.
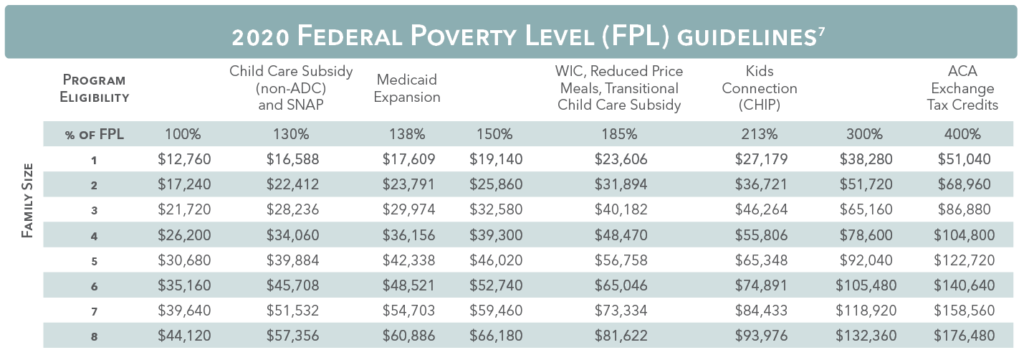
4. HH Poverty Guidelines for 2020.
5. U.S. Census, 2019 American Community Survey 1-year estimate, Table B17024
6. U.S. Census Bureau, 2018 American Community Survey 5-year Estimates, Table B17001H
7. Nebraska Department of Health and Human Services, Child Care
Making Ends Meet
Making ends meet
Nebraskans pride themselves on being hard-working people. In 2019, 79.4% of children in our state had all available parents in the workforce.1 Unfortunately, having high labor force participation doesn’t always translate into family economic stability.
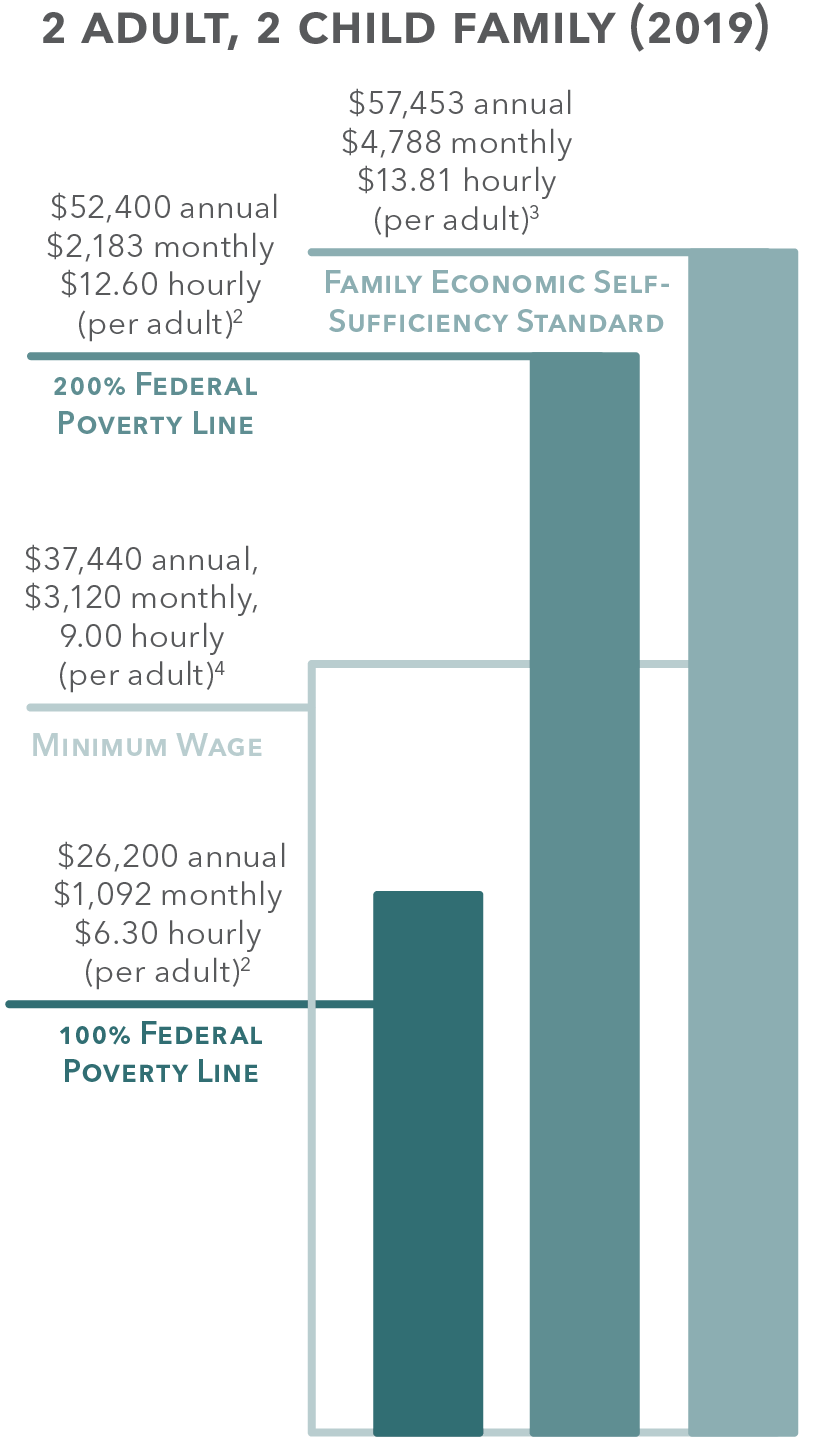
The chart at right illustrates the gap between low-wage earnings and the amount needed to provide for a two-parent family with two children. It assumes that both parents work full-time (40 hours a week), year round (52 weeks per year). That means no vacation, no sick time, just work.
The federal poverty level doesn’t describe what it takes for working families to make ends meet. For that we turn to the Family Economic Self-Sufficiency Standard (FESS). The FESS uses average costs, like fair median rent and the average price of a basic menu of food, to calculate what a family needs to earn to meet its basic needs without any form of private or public assistance. It does not include luxuries like dining out or saving for the future.
Voices for Children publishes a tool that shows what the FESS is for every county and most family types. Check it out at familybottomline.com
2. HH Poverty Guidelines for 2020.
3. Voices for Children in Nebraska, Family Bottom Line
4. US Department of Labor
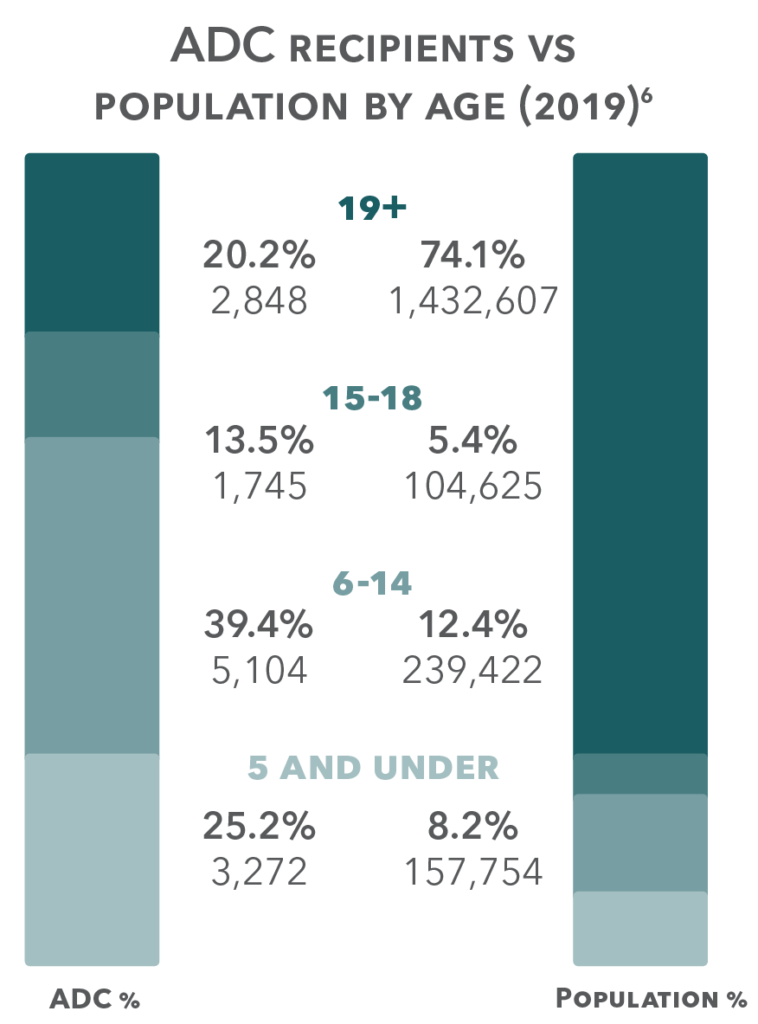
6. Annual Estimates of the Resident Population: July 1, 2019, Table PEPSYASEX
Housing & Homelessness
Homelessness
With funds from the Nebraska Homeless Assistance Program (NHAP), agencies served people who were experiencing homelessness or near homelessness. NHAP is funded through the Housing and Urban Development Emergency Solutions Grant Program and the Nebraska Homeless Shelter Assistance Trust Fund. Not all eligible people receive services with NHAP funding.
In 2019, with NHAP funds, homeless assistance providers served::
8,432
homeless individuals.
1,597
homeless children ages 18
and under.
2,536
homeless families with children.
35
unaccompanied homeless children.
2,760
individuals at risk of homelessness.
1,305
children at risk of homelessness.
2,130
families with children at risk of homelessness.
1
unaccompanied children at risk of homelessness.
In 2016, Nebraska Public Housing had:2
- 7,361 public housing units with 7,061 occupied.
- 12,949 vouchers with 11,609 in use.
- 4,789 units were 1 bedroom (non-family).
Housing of Nebraska children:
- 42,000 children lived in crowded housing.3
- 42,000 children lived in areas of concentrated poverty.3
- 109,000 children lived in households with a high housing cost burden.3,4
- 91,000 children were low-income with a high housing cost burden.3
Homeownership
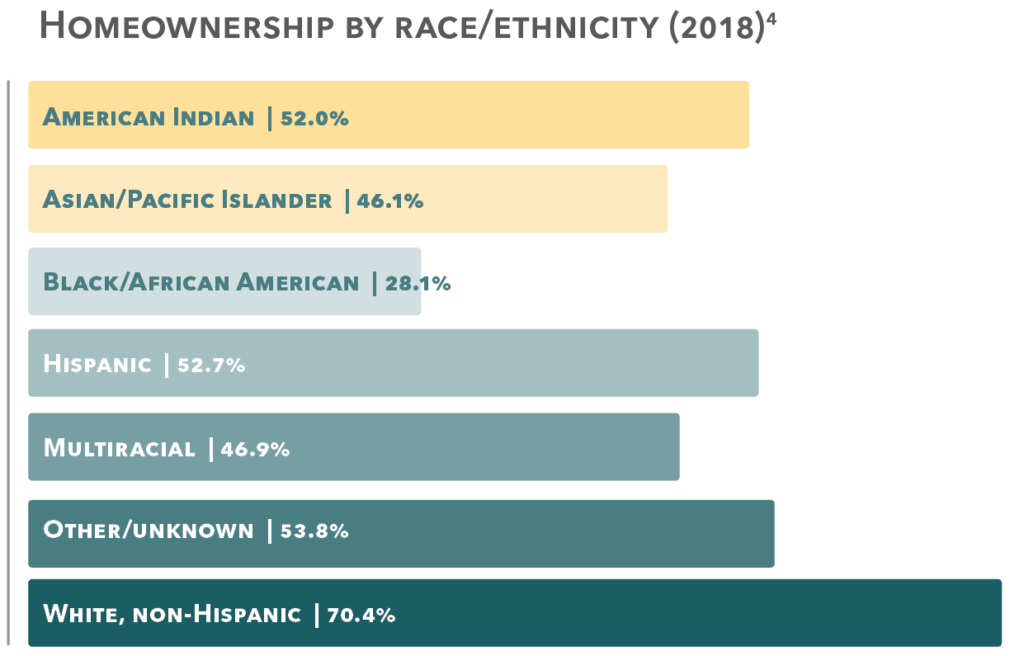
Homeownership provides a sense of stability for children and communities.
70.3% of families with children owned their home in 2019.1
Homeownership
In 2019, Nebraska Public Housing had:2
12,653 vouchers
7,181 public housing units
4,658 units were one bedroom (non-family).
38,000 children (8%) lived in crowded housing with more than one person/room.3
24,000 children (5%) lived in areas of concentrated poverty.3
98,000 children (21%) lived in households with a high housing cost burden.3
79,000 children (49%) low-income households had a high housing cost burden.3
2. Nebraska Office of Public Housing, HUD.
3. Annie E. Casey Foundation, Kids Count Data Center.
4. U.S. Census Bureau, 2018 American Community Survey 5-year Estimates, Table B17001B-I.
Hunger
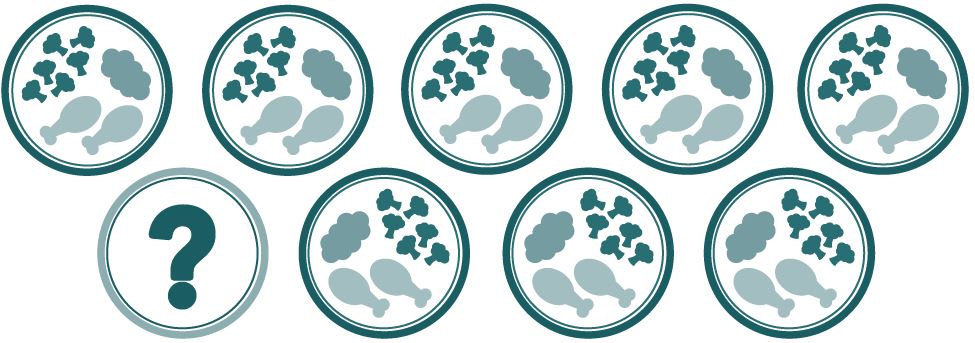
1 in 9 Nebraska households don’t know where their next meal is coming from.1
Food insecure households in Nebraska (2009-2019)1
Approximately 84,348 households in Nebraska were food-insecure in 2019, a decrease from 88,350 in 2018. This means that someone in the household has disrupted their eating patterns or reduced their intake of food because there was not enough food in the house to eat.
16.7% of Nebraska children experienced food insecurity (2018).2
64.0% of food insecure children are likely eligible for federal nutrition assistance (2017).2
2. Feeding America, Map the Meal Gap, Child Food Insecurity in Nebraska, 2018.
SNAP & WIC
Supplemental Nutrition Assistance Program
The Supplemental Nutrition Assistance Program (SNAP) is one of the most effective anti-poverty programs in the United States. It provides nutrition assistance to low-income individuals and families through benefits that can be used to purchase food at grocery stores, farmers markets, and other places where groceries are sold.
In Nebraska in 2017, SNAP moved about 8,700 households above the poverty line.
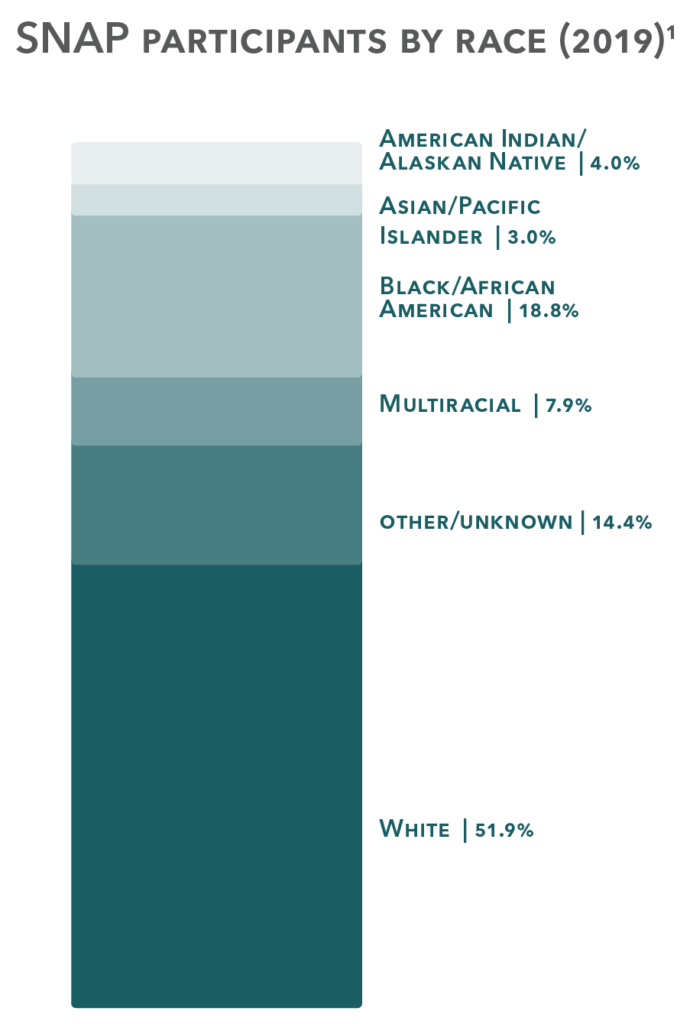
Average number of children enrolled in SNAP (June 2010-2019)
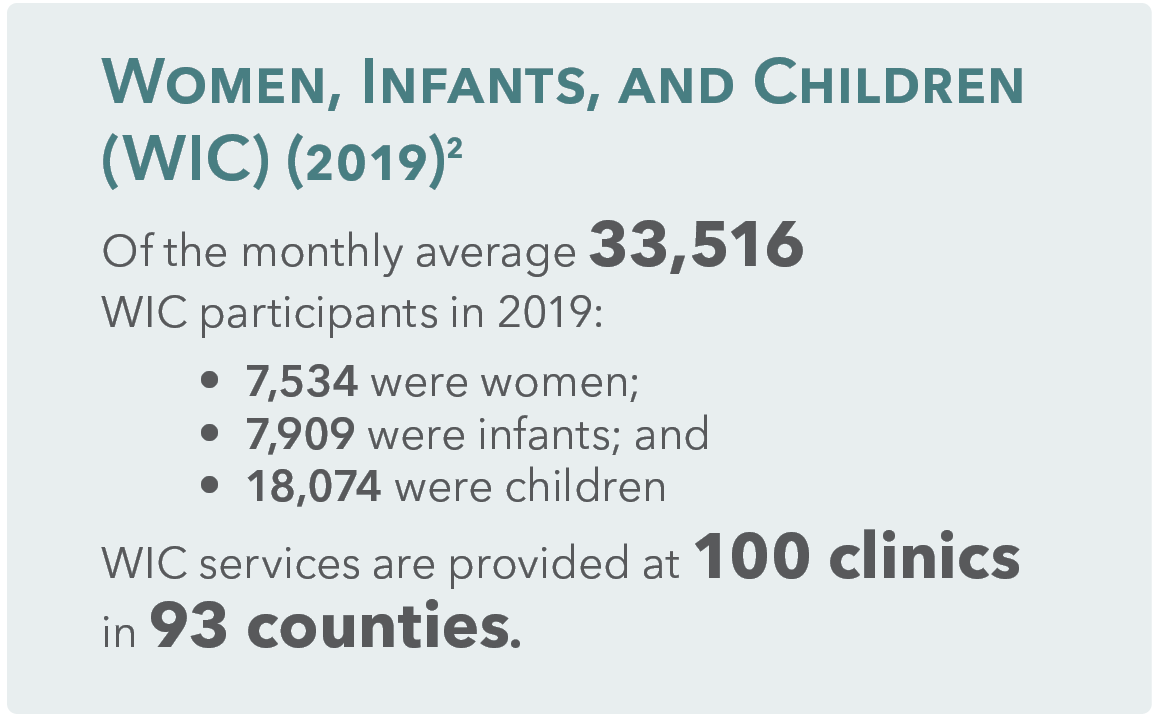
The Special Supplemental Nutrition Program for Women, Infants, and Children—known as WIC—aims to improve the health of low-income pregnant, postpartum, and breastfeeding women, infants, and children up to age five who are at nutritional risk. The program provides nutritious foods to supplement diets, information on healthy eating, breastfeeding promotion and support, and referrals to health care.
Custody
Marriage and divorce
In 2019:
10,665 couples were married and
5,143 were divorced.
4,584 children
experienced their parents divorcing.
1,047 children
were put under their mother’s custody.
157 children
were put under their father’s custody.
1,267 children
were put under both parent’s custody.
33 children
were given a different arrangement.
Source: Vital Statistics, Nebraska Department of Health and Human Services (DHHS).
Informal kinship care:
Children are considered to be in informal kinship care if they are not living with a parent or foster parent and are not living independently.
13,000 (3.0%)1
children were living in kinship care (2018)
10,861 (2.3%)2
were living with a grandparent who was their primary caregiver in 2019.
2. U.S. Census Bureau, 2019 American Community Survey 1-year Estimates, Table B10002; U.S. Census Bureau, Annual Estimates of the Resident Population: July 1, 2019. Table PEPSYASEX.
Child support (2019)
Custodial parents who do not receive child support payments they are owed by non-custodial parents may seek assistance from the Department of Health and Human Services. Assistance is provided by Child Support Enforcement (CSE).
- 100,820 cases received CSE assistance, this is 71.7% of child support cases in Nebraska.
- 94,795 were non-ADC cases.*
- 6,025 were ADC cases.*
- $216,789,594 Amount of child support collected through CSE.
- 16,208 cases received services through CSE, but payments were not being made.
- 2,402 cases receiving public benefits who are eligible for and are receiving child support payments.
- 1,398 cases received public benefits who are eligible for child support, phentermineonlineguide.net being paid.
- 4,006 child support cases where non-custodial parent is incarcerated.
- $115.51 mean monthly child support payment per child.
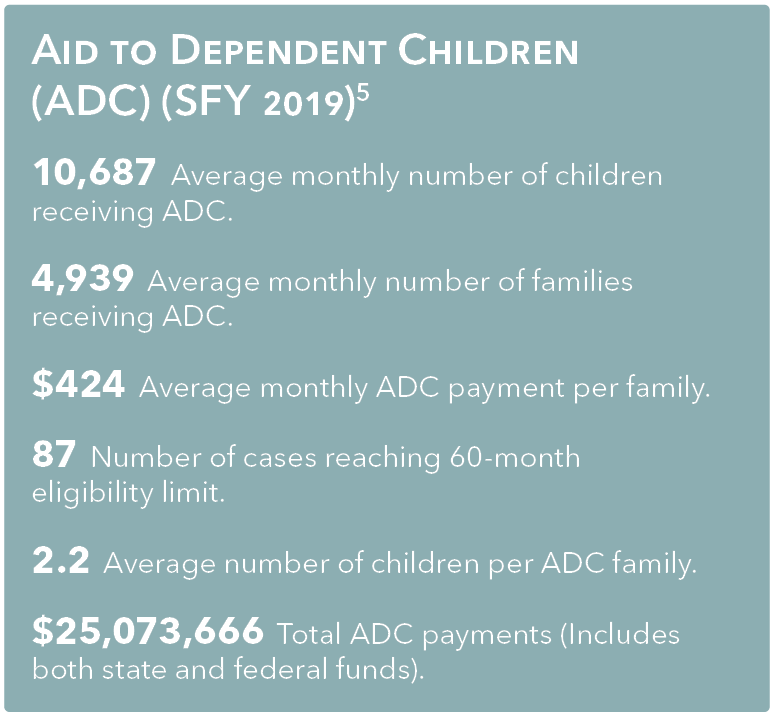
* If the custodial parent is receiving ADC, the state is entitled to collect child support from the non-custodial parent as reimbursement.
Employment & Income
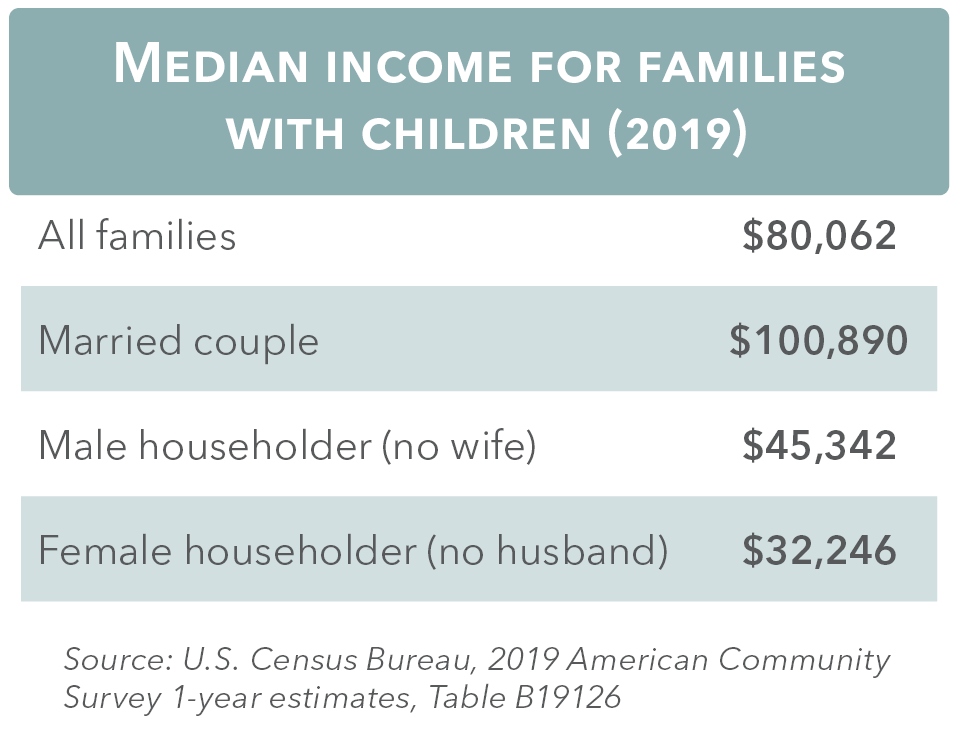
In 2019,
79.4%
of children under 18 had all available parents in the workforce.
In 2019,
76.2%
of children under 6 had all available parents in the workforce
Nebraska unemployment and underemployment rate (2009-2019)
- Unemployment
- Underemployment
- Unemployment
- Underemployment
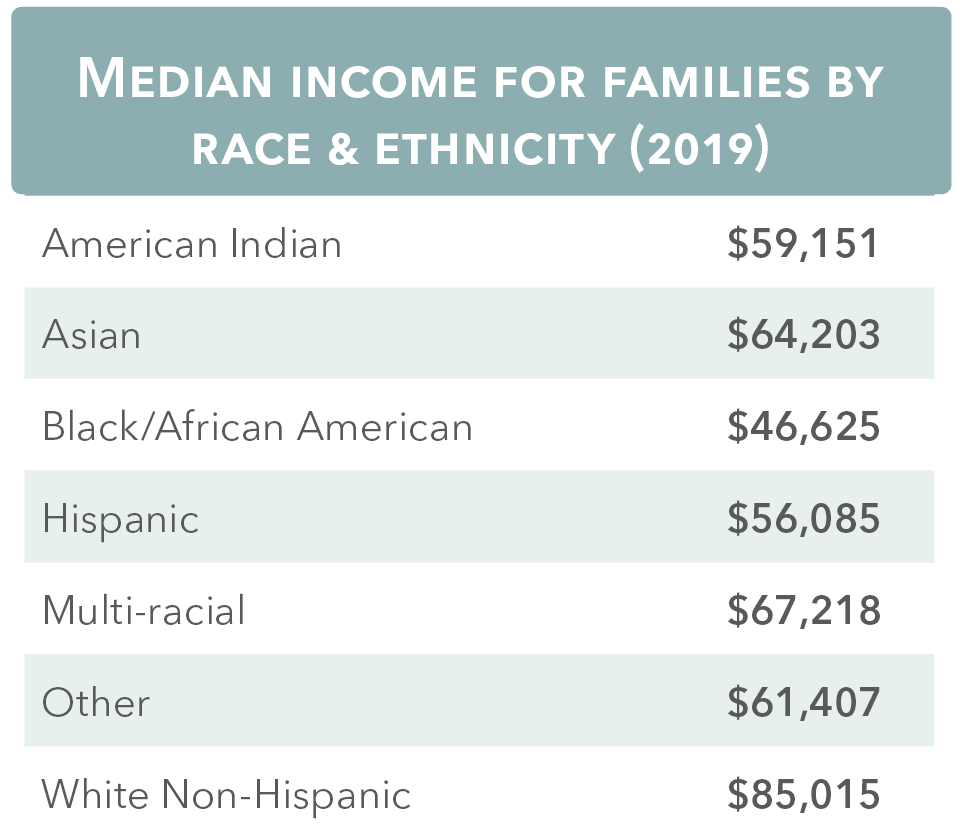
7,000 workers in Nebraska earned minimum wage or below in 2018.1
17.1% of Nebraska workers were working in a low-wage job, meaning the median annual pay is below the poverty line for a family of four.2
2. Prosperity Now Scorecard, Financial Assets and Income, 2019.
21.5%
of Nebraskans experience asset poverty.2
Asset poverty: A household is considered to be in asset poverty if they do not have sufficient net worth at the Federal Poverty Line to subsist without income for three months.
Transportation & Taxes
Family tax credits (2019)
122,262 families claimed $291,705,995 in federal Earned Income Tax Credit (EITC).
126,905 families claimed $29,515,537 in state Earned Income Tax Credit.
227,889 families claimed $561,265,500 in federal Child Tax Credit.
51,879 families claimed $29,318,393 in federal Child and Dependent Care Credit.
54,185 families claimed $10,301,293 in state Child and Dependent Care Credit.
104,080 families claimed $198,171,596 in Additional Child Tax Credit.
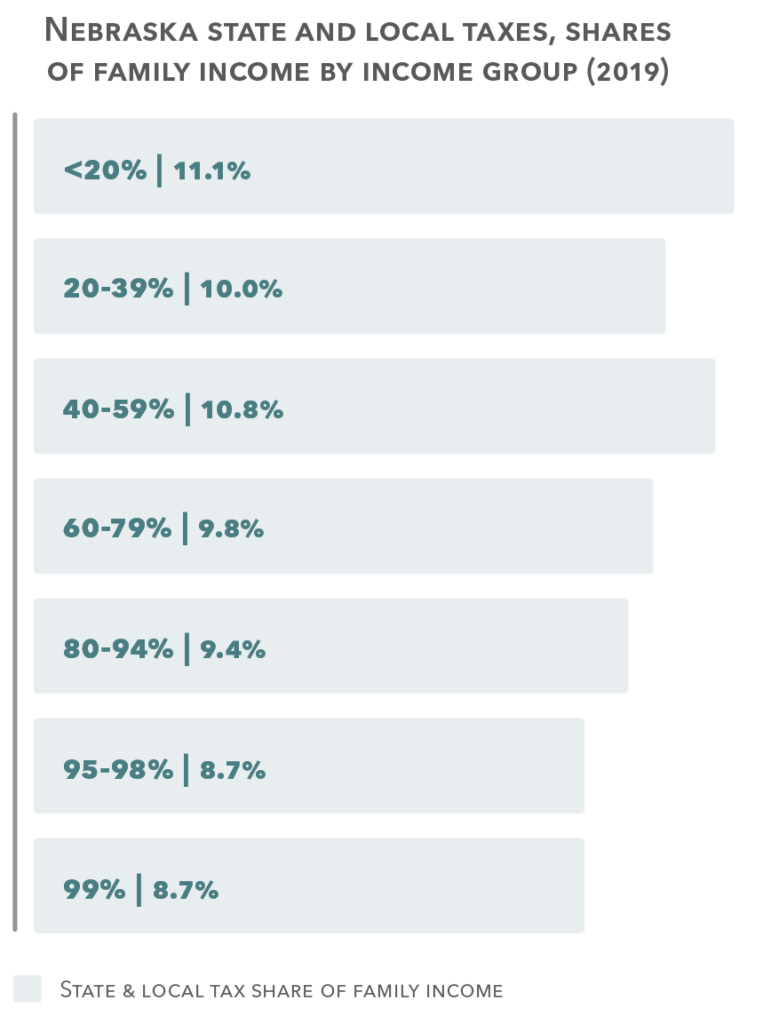
Source: Source: ITEP, Who Pays? A Distributional Analysis of the Tax Systems, Nebraska, 2018.
41,559 (5.4%) households had no vehicle available in 2019.
Source: U.S. Census Bureau, 2019 American Community Survey 1-year Estimates, Table B08201.

