Education is the surest way to build a pathway to lifelong success, and the early years of a child’s life are imperative to laying a solid foundation for success. Establishing the conditions that promote educational achievement for children is critical,. With a strong and healthy early beginning, children can more easily stay on track to remain in school, graduate on time, pursue postsecondary education and training and enjoy a successful transition into adulthood. Closing gaps in educational access and quality is key to ensuring the future workforce can compete and build or continue the cycle of success and independence.
Child care
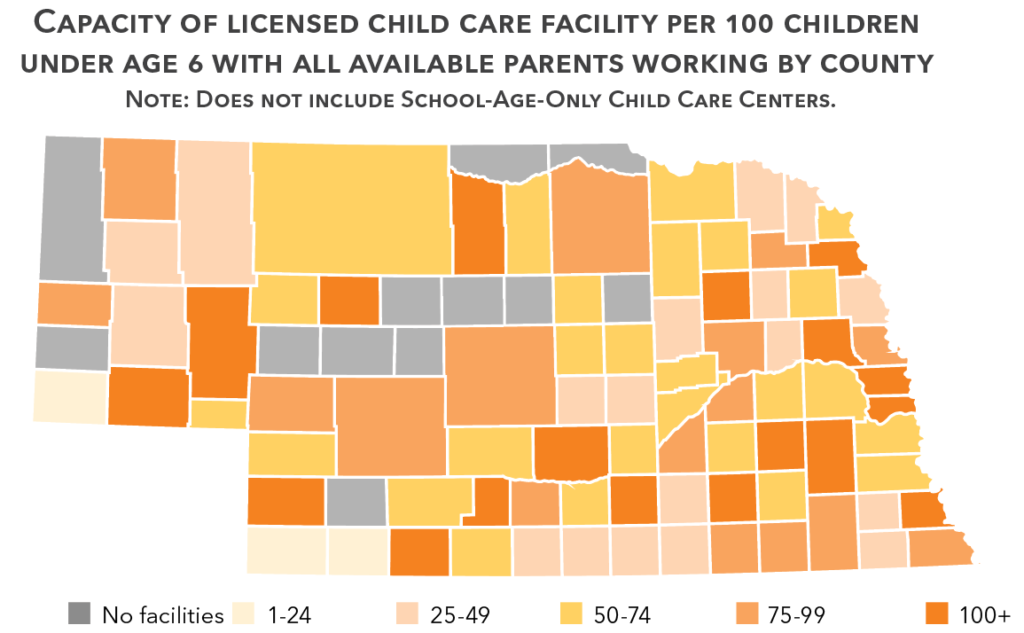
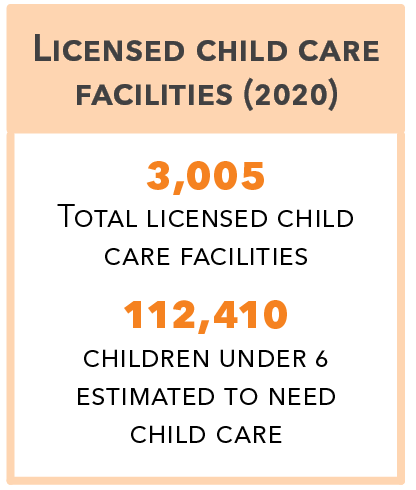
Source: Roseter of Licensed Child Care and Preschool Programs in Nebraska; U.S. Census 2018 American Community Survey 5-Year Estimate, Table B23008.
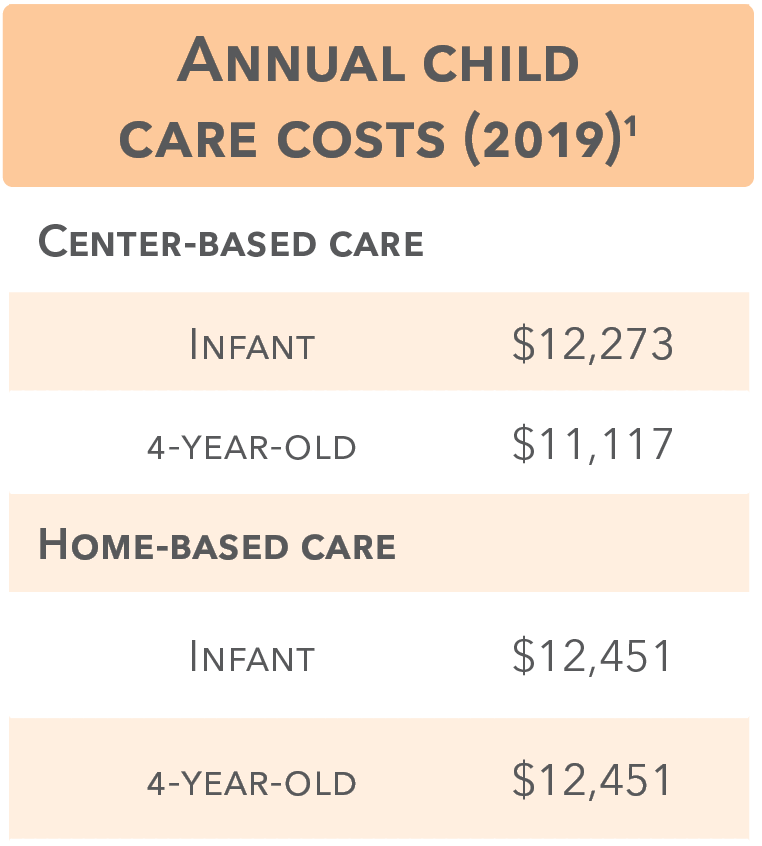
5.4% (8,644)
Nebraska parents of children 0-5 quit, did not take, or greatly
changed their job because of child care problems in 2018-19.2
Child care subsidies (SFY 2019)3
- There were 27,892 children in Nebraska who received child care subsidies in SFY 2019. 1,705 children were in the care of a license-exempt facility.
- An average of 16,718 children received a subsidy each month for an average of 7 months. 12,257 were below school age, and 5,931 were school age.
- 18,394 children receiving a subsidy were from a family living below 100% FPL, 5,051 were from families between 100%-130% FPL and 2,754 were from families between 130%-185% FPL.
- $54,822,017 in state and $47,518,650 in federal funds were spent on the child care subsidy program.
2. 2018-2019 National Survey of Children’s Health, Family Health and Activities, Indicator 6.17.
3. Nebraska Department of Health and Human Services (DHHS).
Step Up to Quality
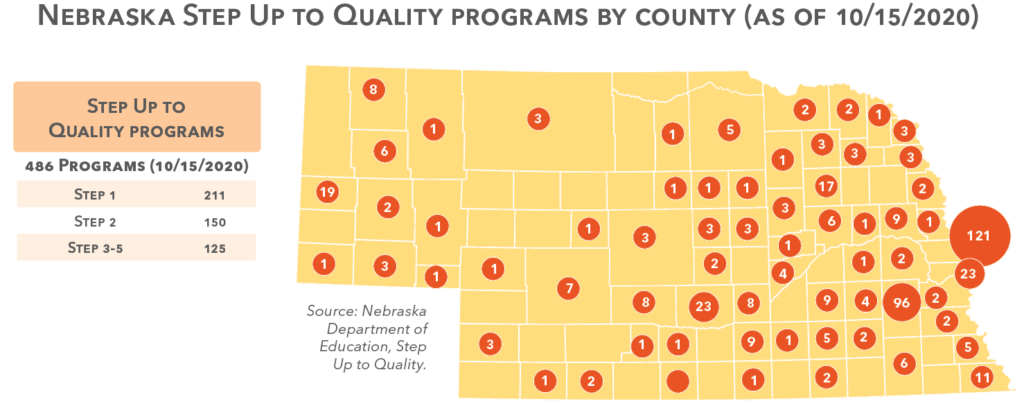
As of 10/15/2020 Nebraska had
486 Step Up to Quality programs
211 Providers – Step 1: The program has completed the application to participate in Step Up to Quality, staff members have submitted a professional record, and the program’s director has completed orientation.
150 Providers – Step 2: The program director completed several trainings related to safety, child health, early learning, and management, as well as several self assessments related to child development knowledge.
125 Providers – Steps 3-5: Once programs achieve Step 2 they are eligible for coaching services. Early childhood coaches help guide programs as they set goals to make program improvements. During the rating process, programs earn points in the following standard areas, curriculum, learning environments & interactions, child outcomes, professional development and training, family engagement & partnerships, and program administration. Step 3-5 ratings are determined by the number of points achieved.
School-based preschool (2018/19)¹
18,255
children were enrolled in public
school-based preschool.
Public school preschool enrollment (2000/01 - 2018/19)¹
Early Development Network (2018/19)
The Early Development Network (EDN) serves families with children born with disabilities.
2,331
infants and toddlers had an Individualized Family Service Plan through EDN.
- 1,955 with a developmental delay
- 129 with a speech language impairment
- 86 with a hearing impairment
- 32 with autism
- 129 with some other disability
Source: Nebraska Department of Education, Office of Special Education.
Sixpence (2018/19)³
Sixpence serves children birth to age three who are at risk of failure in school and is funded through public and private dollars. There were 31 Sixpence programs in the state of Nebraska in the 2018/19 program year serving:
- 969 families
- 85 pregnant moms
- 1,131 children
6,340
children were served in 19 Early Head Start and 19 Head Start Programs in the 2018/19 program year.²
144
pregnant women were served in Early Head Start in the 2018/19 program year.²
7.9%
of the children served by Early Head Start/Head Start in 2018/19 were homless and 4.9 were in foster care.²
1. Nebraska Department of Education.
2. Nebraska Department of Education, Head Start State Collaborative Office.
3. Sixpence Early Learning Fund 2018-19 Evaluation Report UNMC.
1. Nebraska Department of Education.
2. Office of Head Start, Program Information Report.
3. Interdisciplinary Center for Program Evaluation, University of Nebraska Medical Center.
K-12 Student Characteristics
4.6%
of Nebraska school students were highly mobile, meaning they enrolled in two or more public schools during the 2018/19 school year. Higher school mobility is correlated with lower achievement.
325,984
children were enrolled in public school in 2018/19.
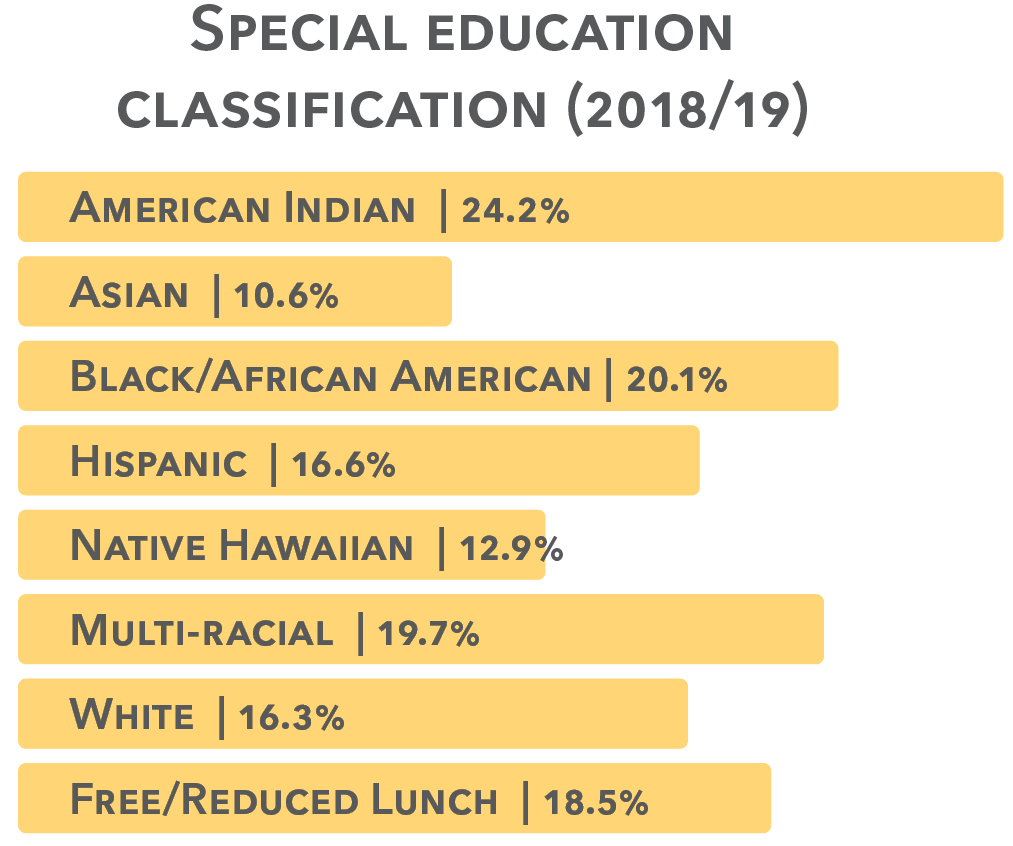

Rate of home schooled students per 1,000 students (2009/10 - 2018/19)
Percent of students who were English language learners (2009/10 - 2018/19)
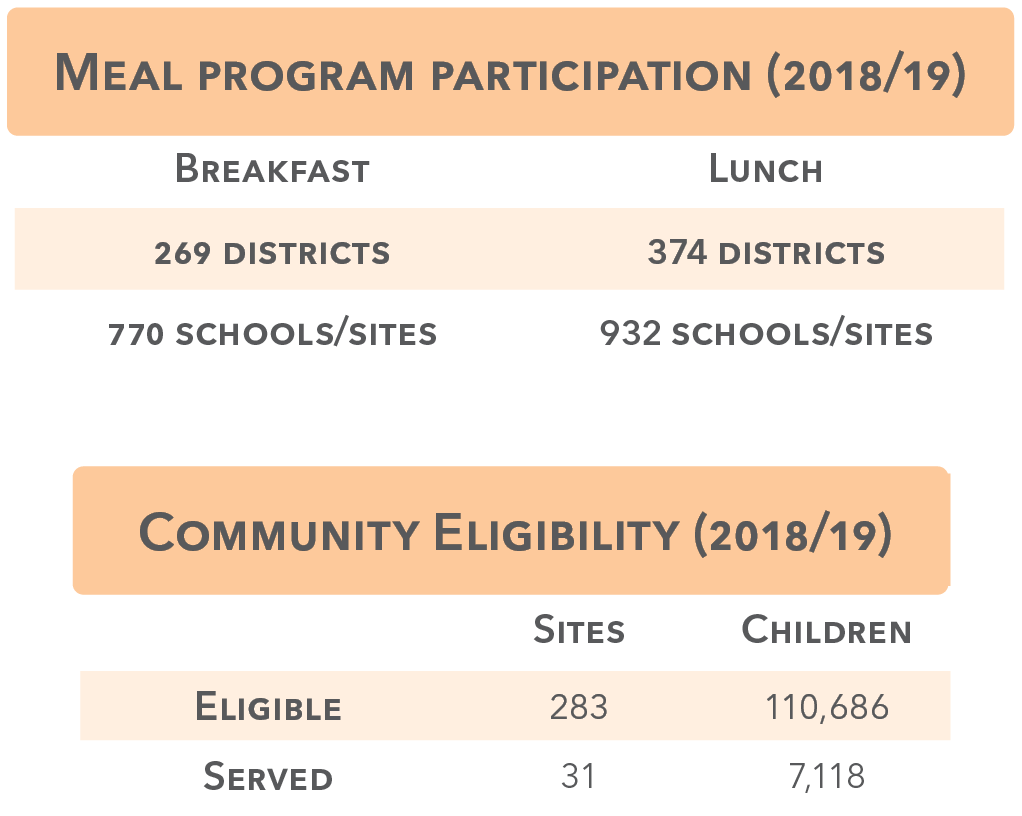
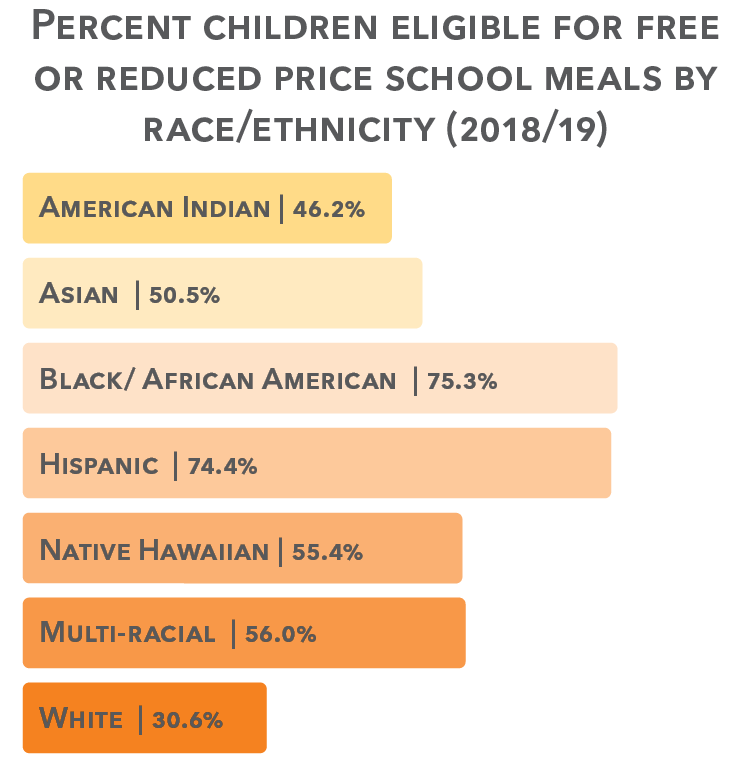
Free/reduced cost school meals
Percent students eligible for free or reduced price school meals (2009/10 - 2018/19)
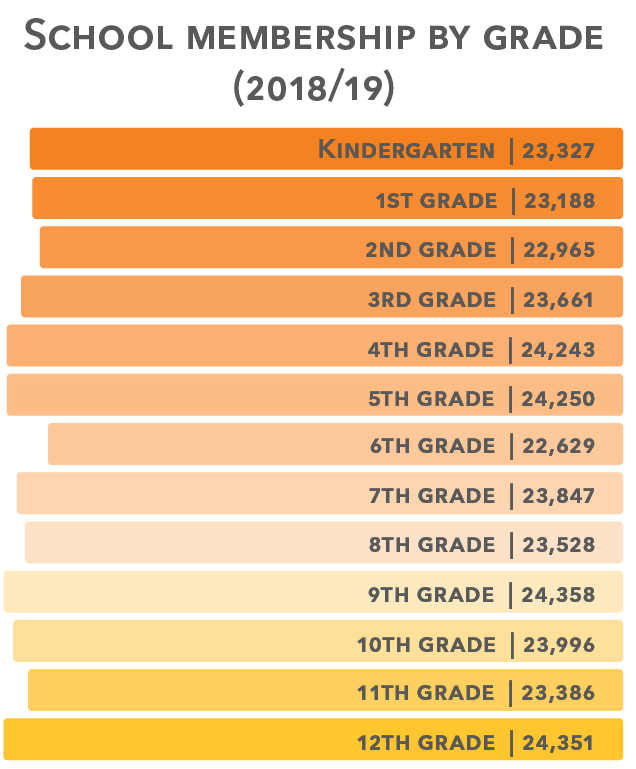
School membership by grade (2015/16)
There were 524 Summer Food Participation sites in 2019, each serving an average of 167 meals daily.
Reading is a fundamental skill that affects learning experiences and school performance of children and teens. The ability to read proficiently translates to a greater likelihood of performing well in other subjects. Children with lower reading achievement are less likely to be engaged in the classroom, graduate high school, and attend college.
Source: Child Trends, Reading Proficiency.
Sources: 3rd and 8th Grade: Nebraska Department of Education, NSCAS English Language Arts Proficiency. 11th Grade: ACT Assessment.
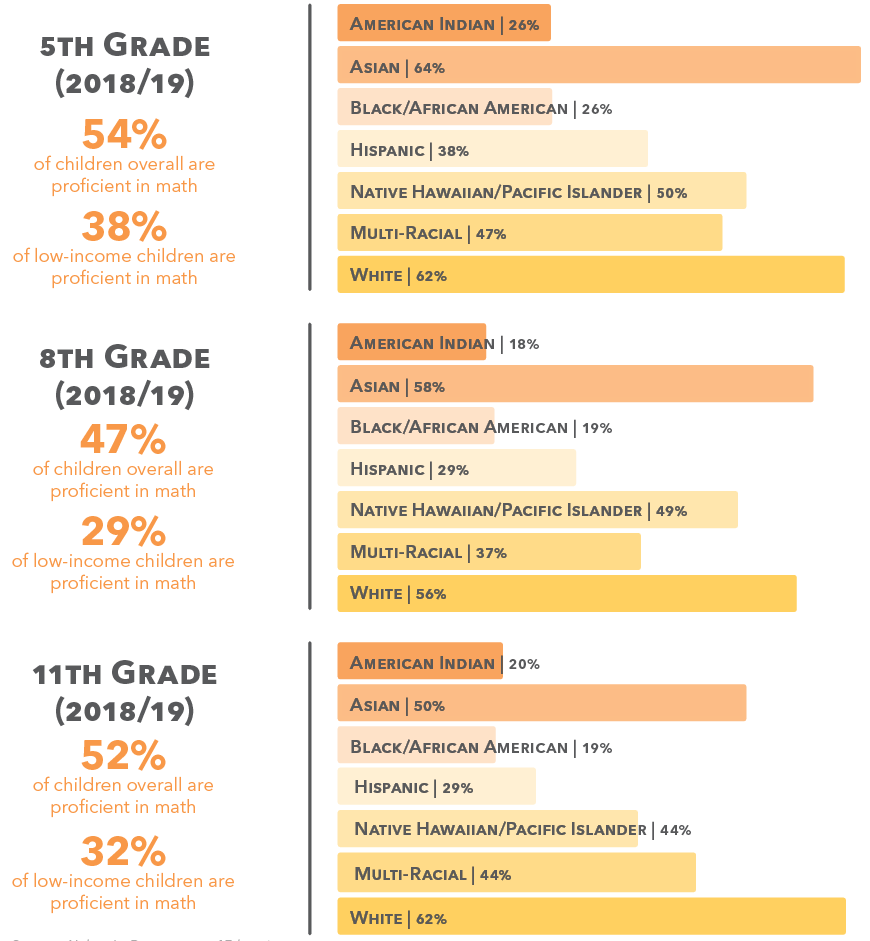
Sources: 5th and 8th Grade: Nebraska Department of Education, NSCAS Mathematics Proficiency; 11th Grade: ACT Assessment.
Source: Child Trends, Science Proficiency.

Sources: 5th and 8th Grade: Nebraska Department of Education, NSCAS Science Proficiency. 11th Grade: ACT Assessment.
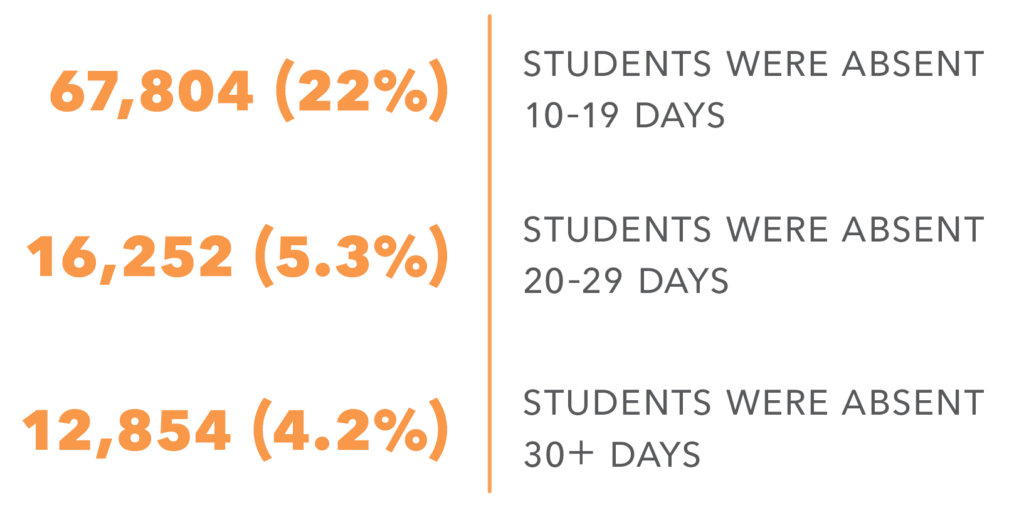
Absences & career readiness
768 (0.3%)
students in public and nonpublic
schools were expelled during the
2018/19 school year.
27,931 (9.0%)
students in public and nonpublic
schools were suspended during
the 2018/19 school year.

1,876
students in public and nonpublic
schools dropped out in 2018/19.
95,000 (51%)
young people age 18- 24 were enrolled in or completed college.3
69.6%
of Nebraska’s 2018/19 public high school graduates had enrolled in college by April 2019.1
43.4%
of students who enrolled in a 2-year public college in fall 2013 completed within six years.1
22,452 students
of the 2019 graduation cohort took the ACT with average composite score of 19.3.2
15,000 (8.0%)
young people age 18-24 were not attending school, not working, and had no degree beyond high school.3
70.0%
of students who enrolled in a 4-year public college in fall 2013 completed within six years.1
15,042 students
were enrolled in a career academy or dual credit courses in 2018/19.1
4,000 (4%)
teens 16-19 were not in school and not working.3
Graduation & educational savings
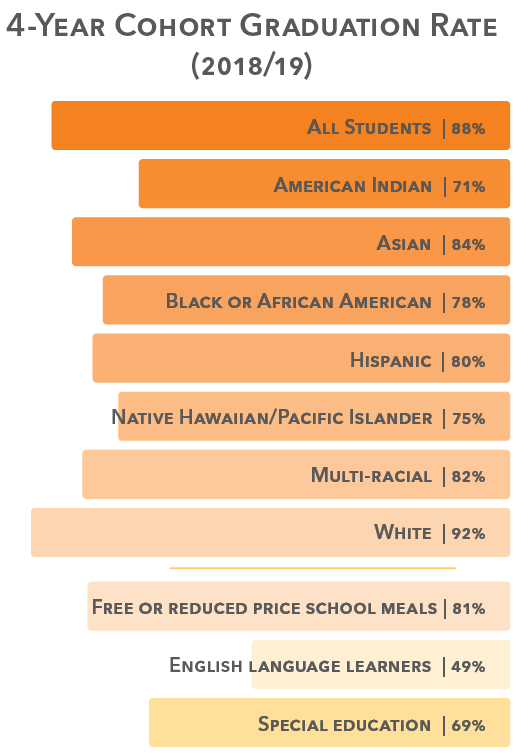
20,491 students
completed high school in four years in 2018/19.
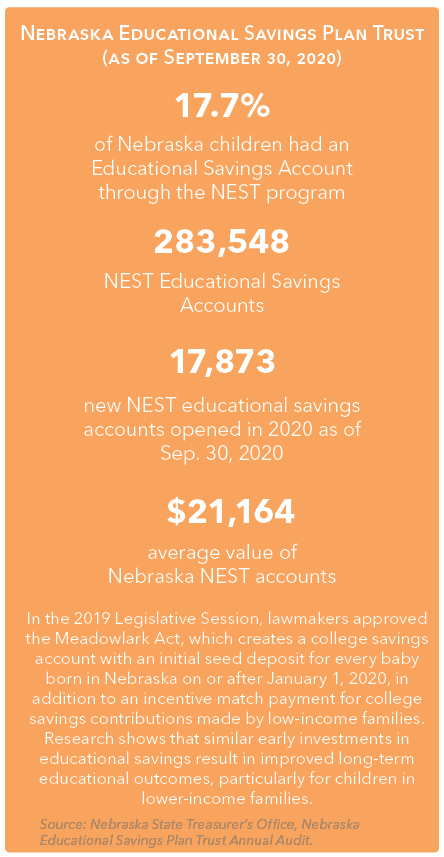
16-21 year olds took the GED in 2017/18 with 57.5% completing successfully.
91.3%
2019 extended 5-year
graduation rate*
a decrease from 91.5%
from the 2017 cohort 5-year
graduation rate.

